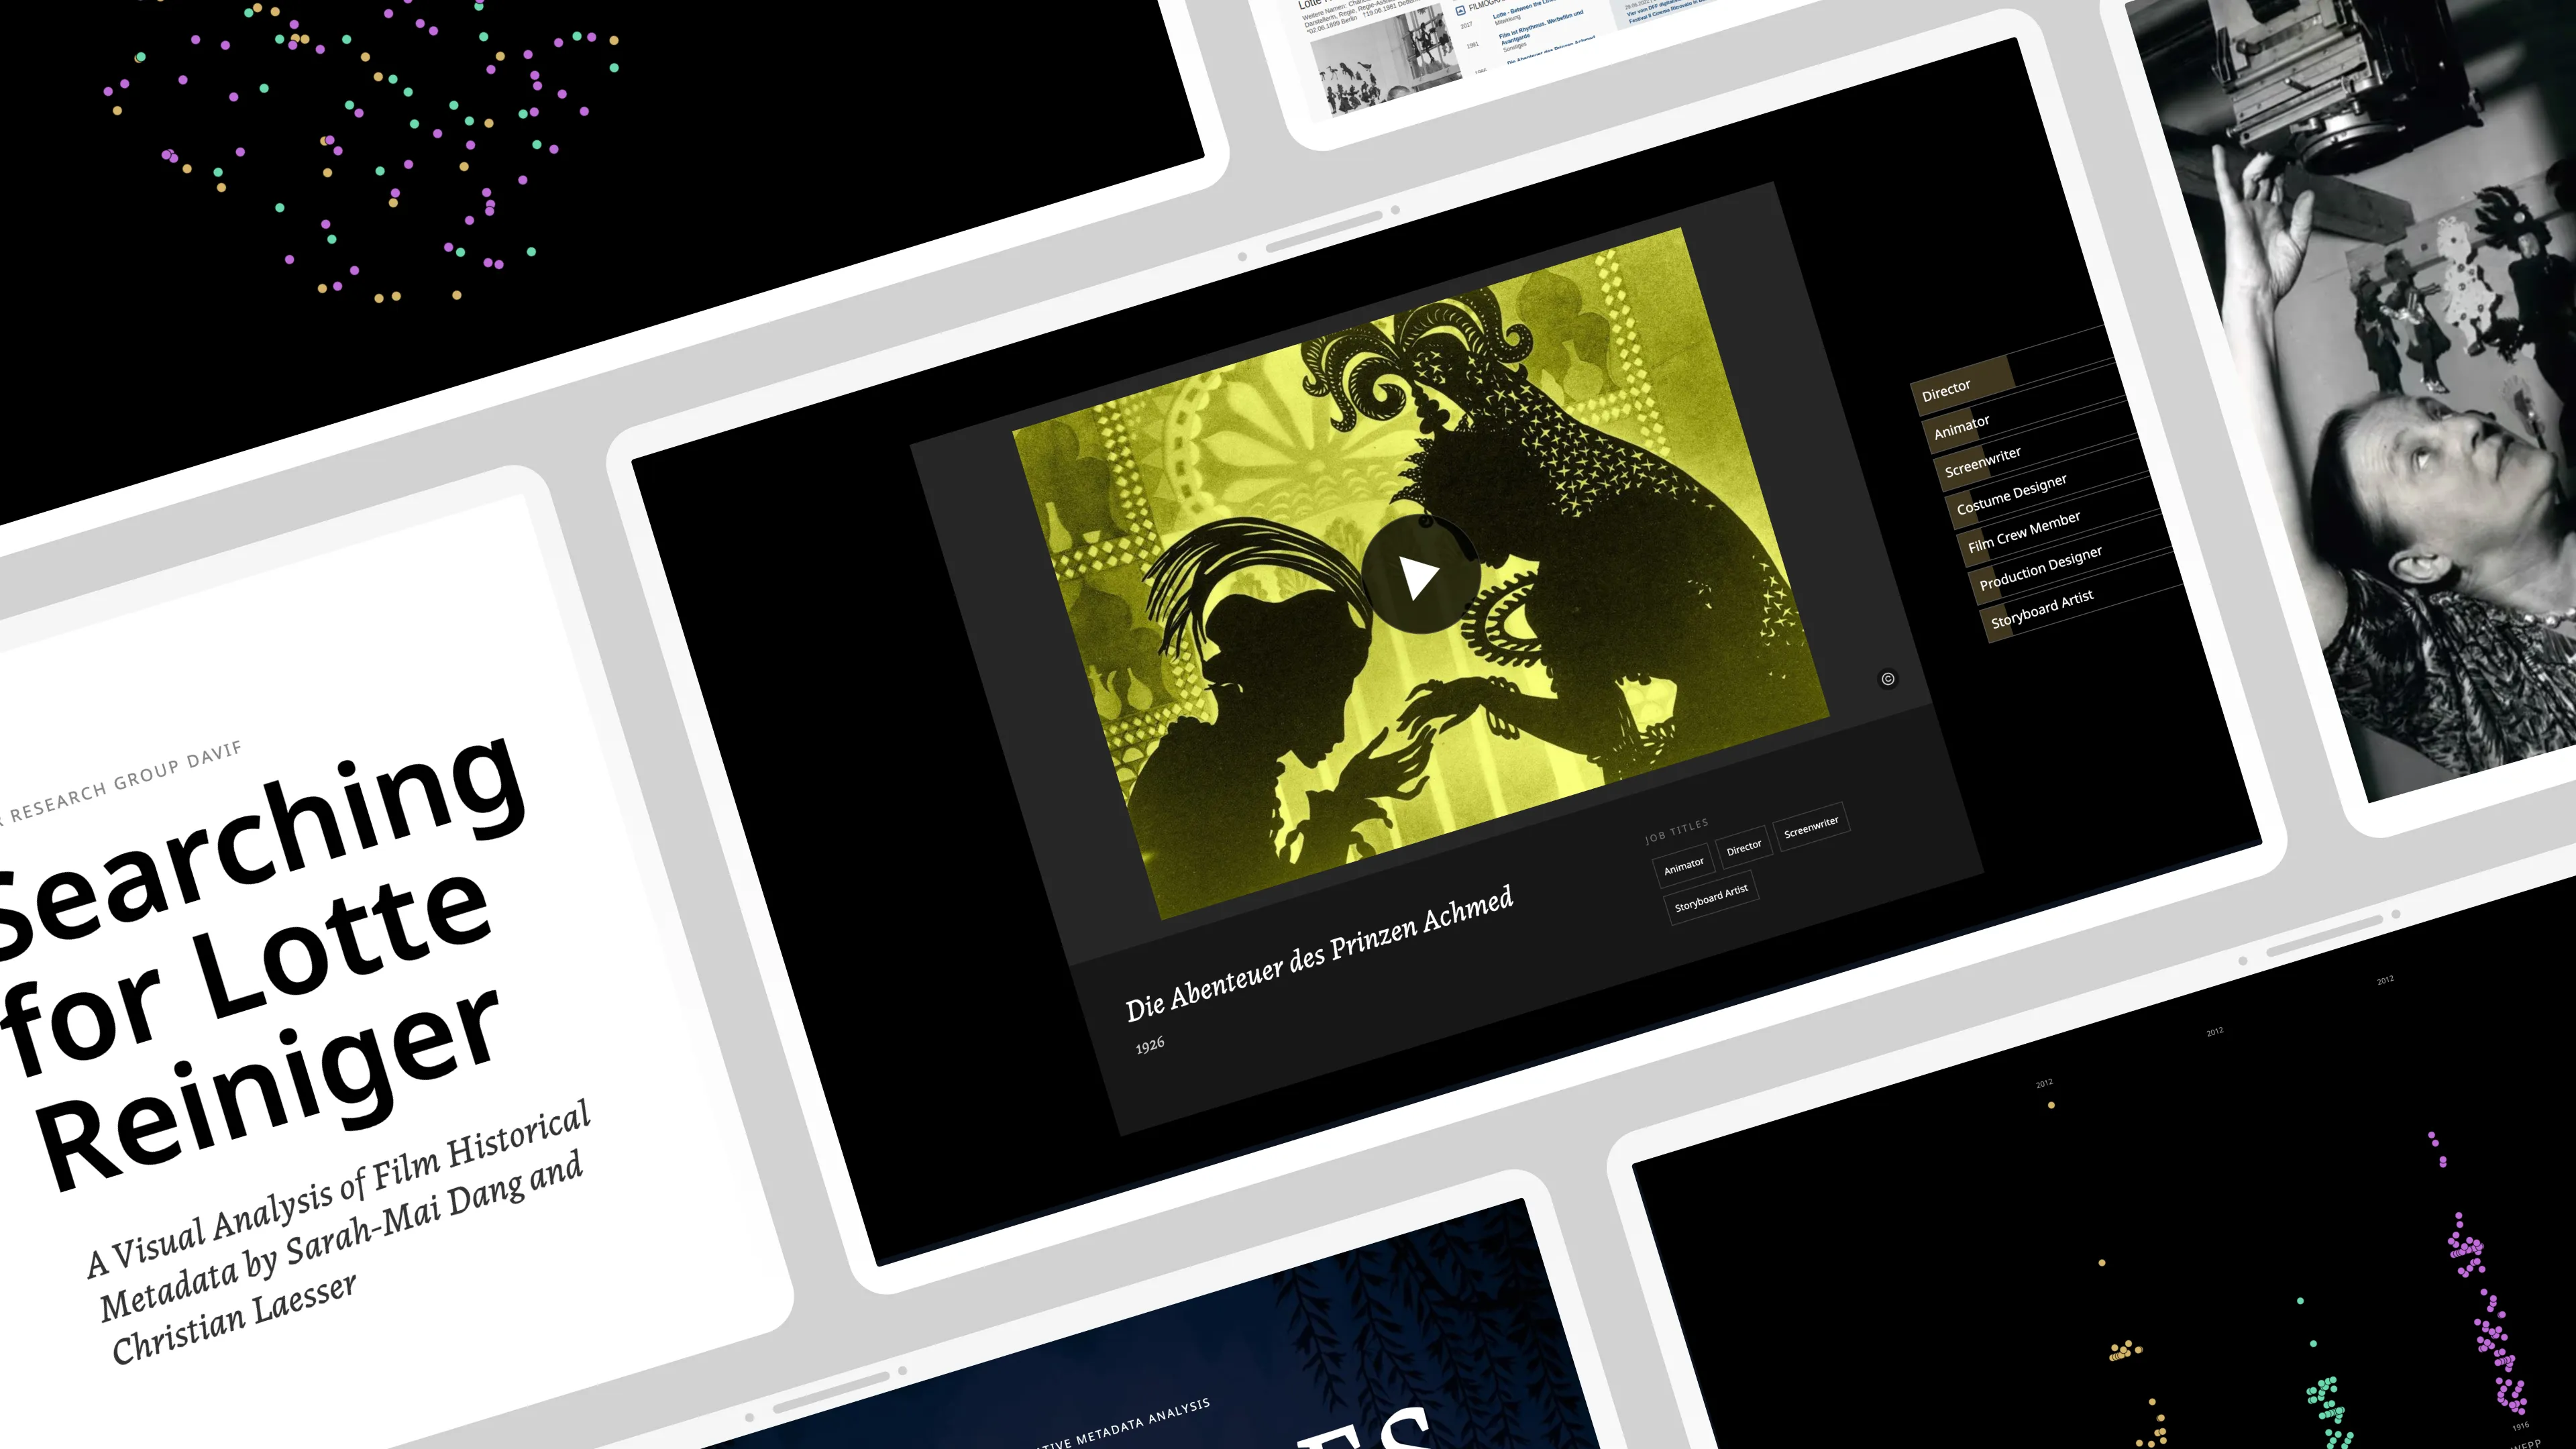
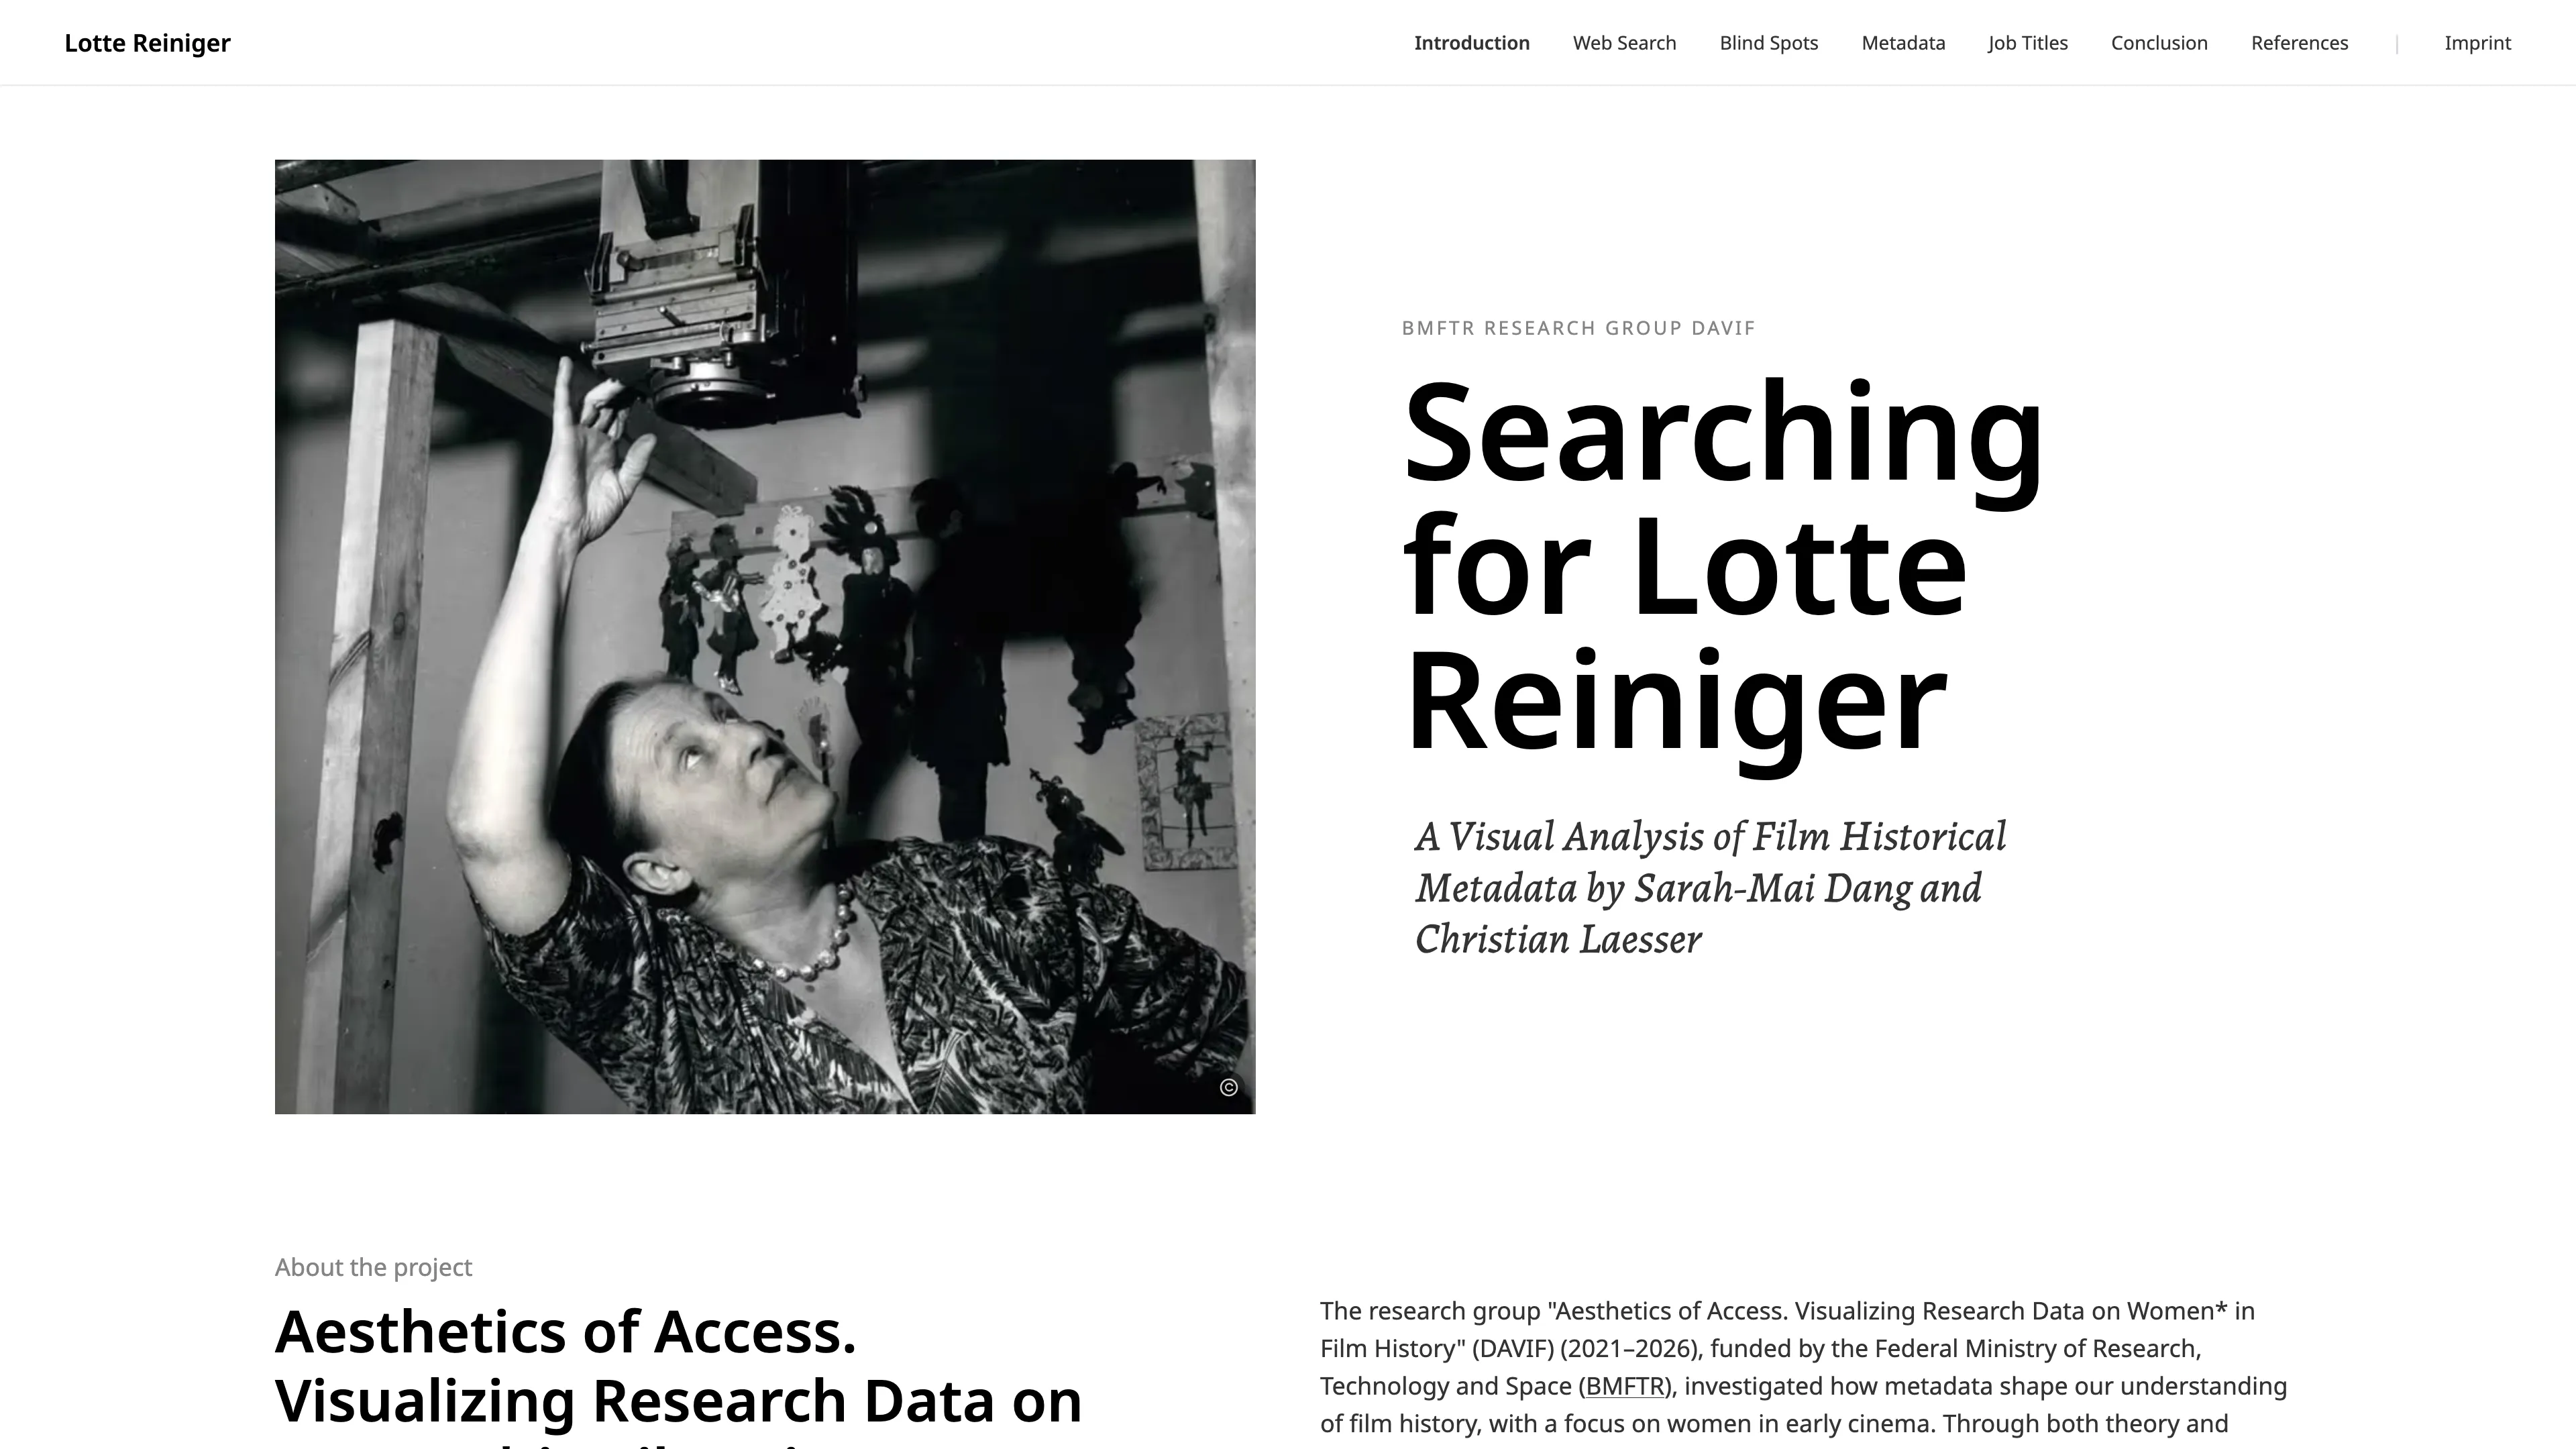
Searching for Lotte Reiniger
A scrollytelling data visualization for the BMFTR Research Group "Aesthetics of Access. Visualizing Research Data on Women in Film History" (DAVIF), turning film-historical metadata gaps into a public argument about whose work gets counted, and whose disappears.
Challenge
Solution
My Contribution
- Client
BMFTR Research Group DAVIF
- My RoleData VisualizationWeb DesignFrontend Development
- Time
2025–2026
- Collaboration
Dr. Sarah-Mai Dang (Principal investigator, co-author, research methodology, editorial direction, and academic analysis)
- Funding
German Federal Ministry of Research, Technology and Space (BMFTR)
Results
Process
-
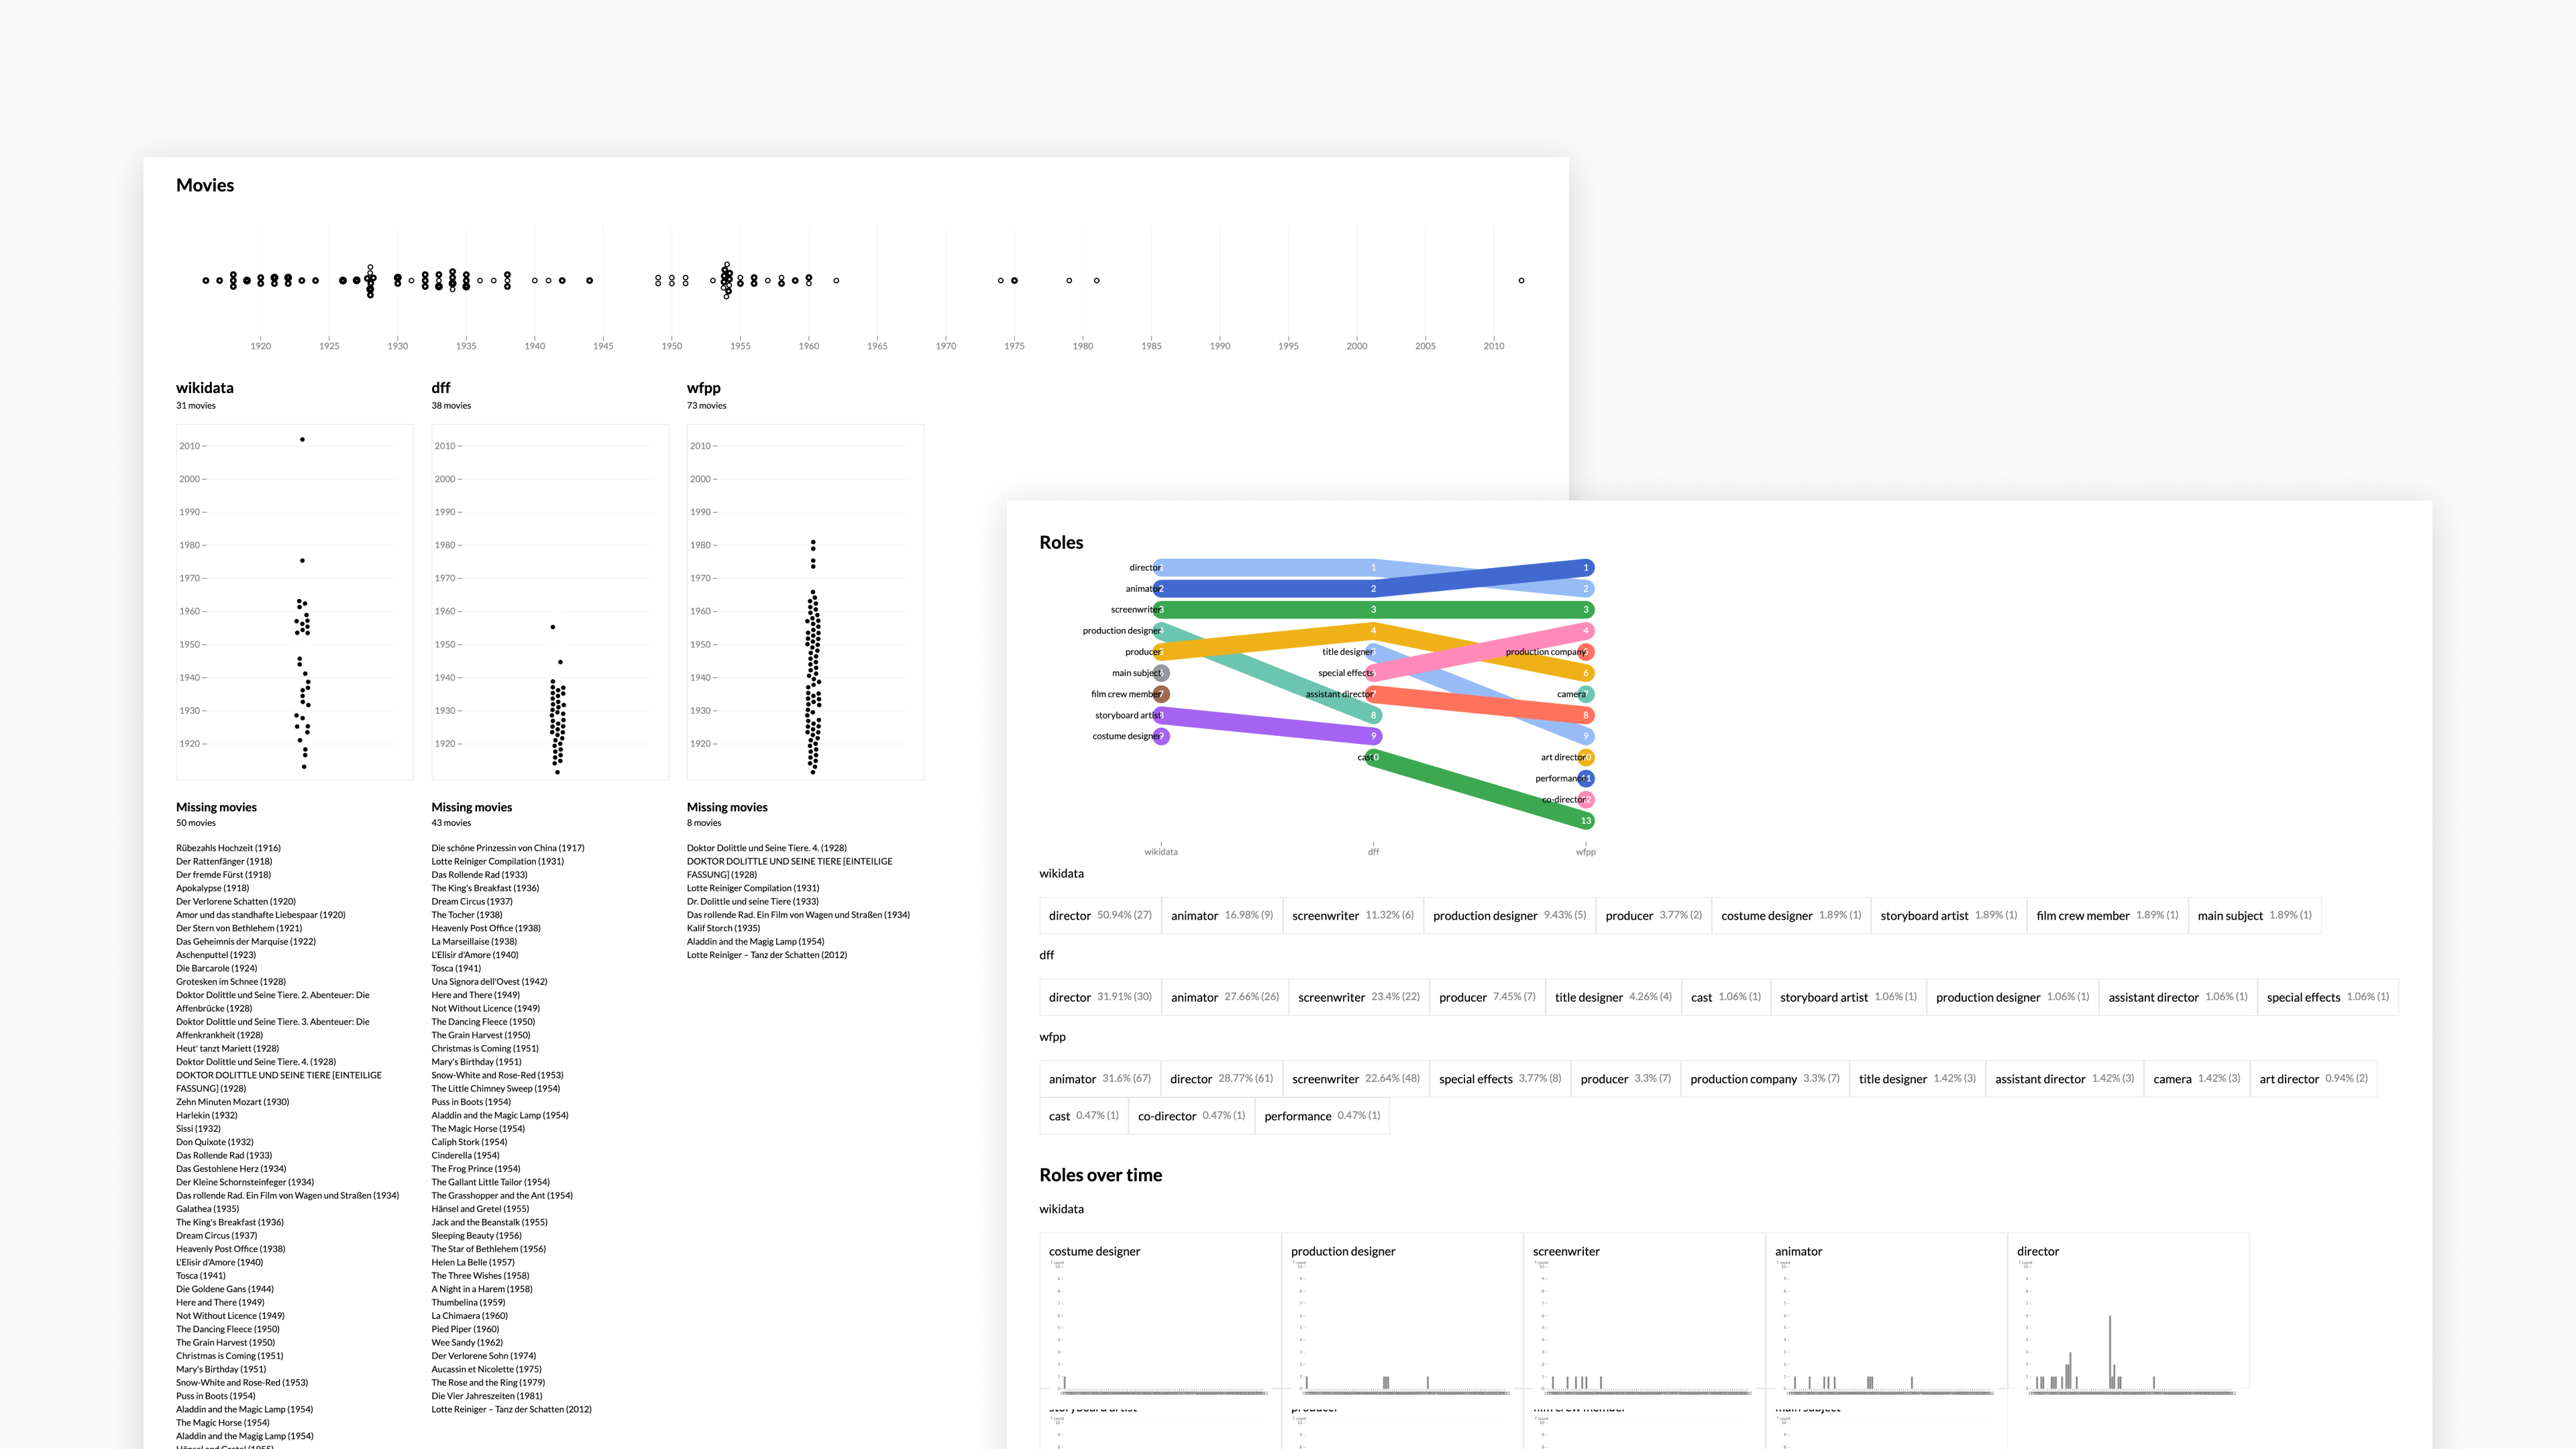
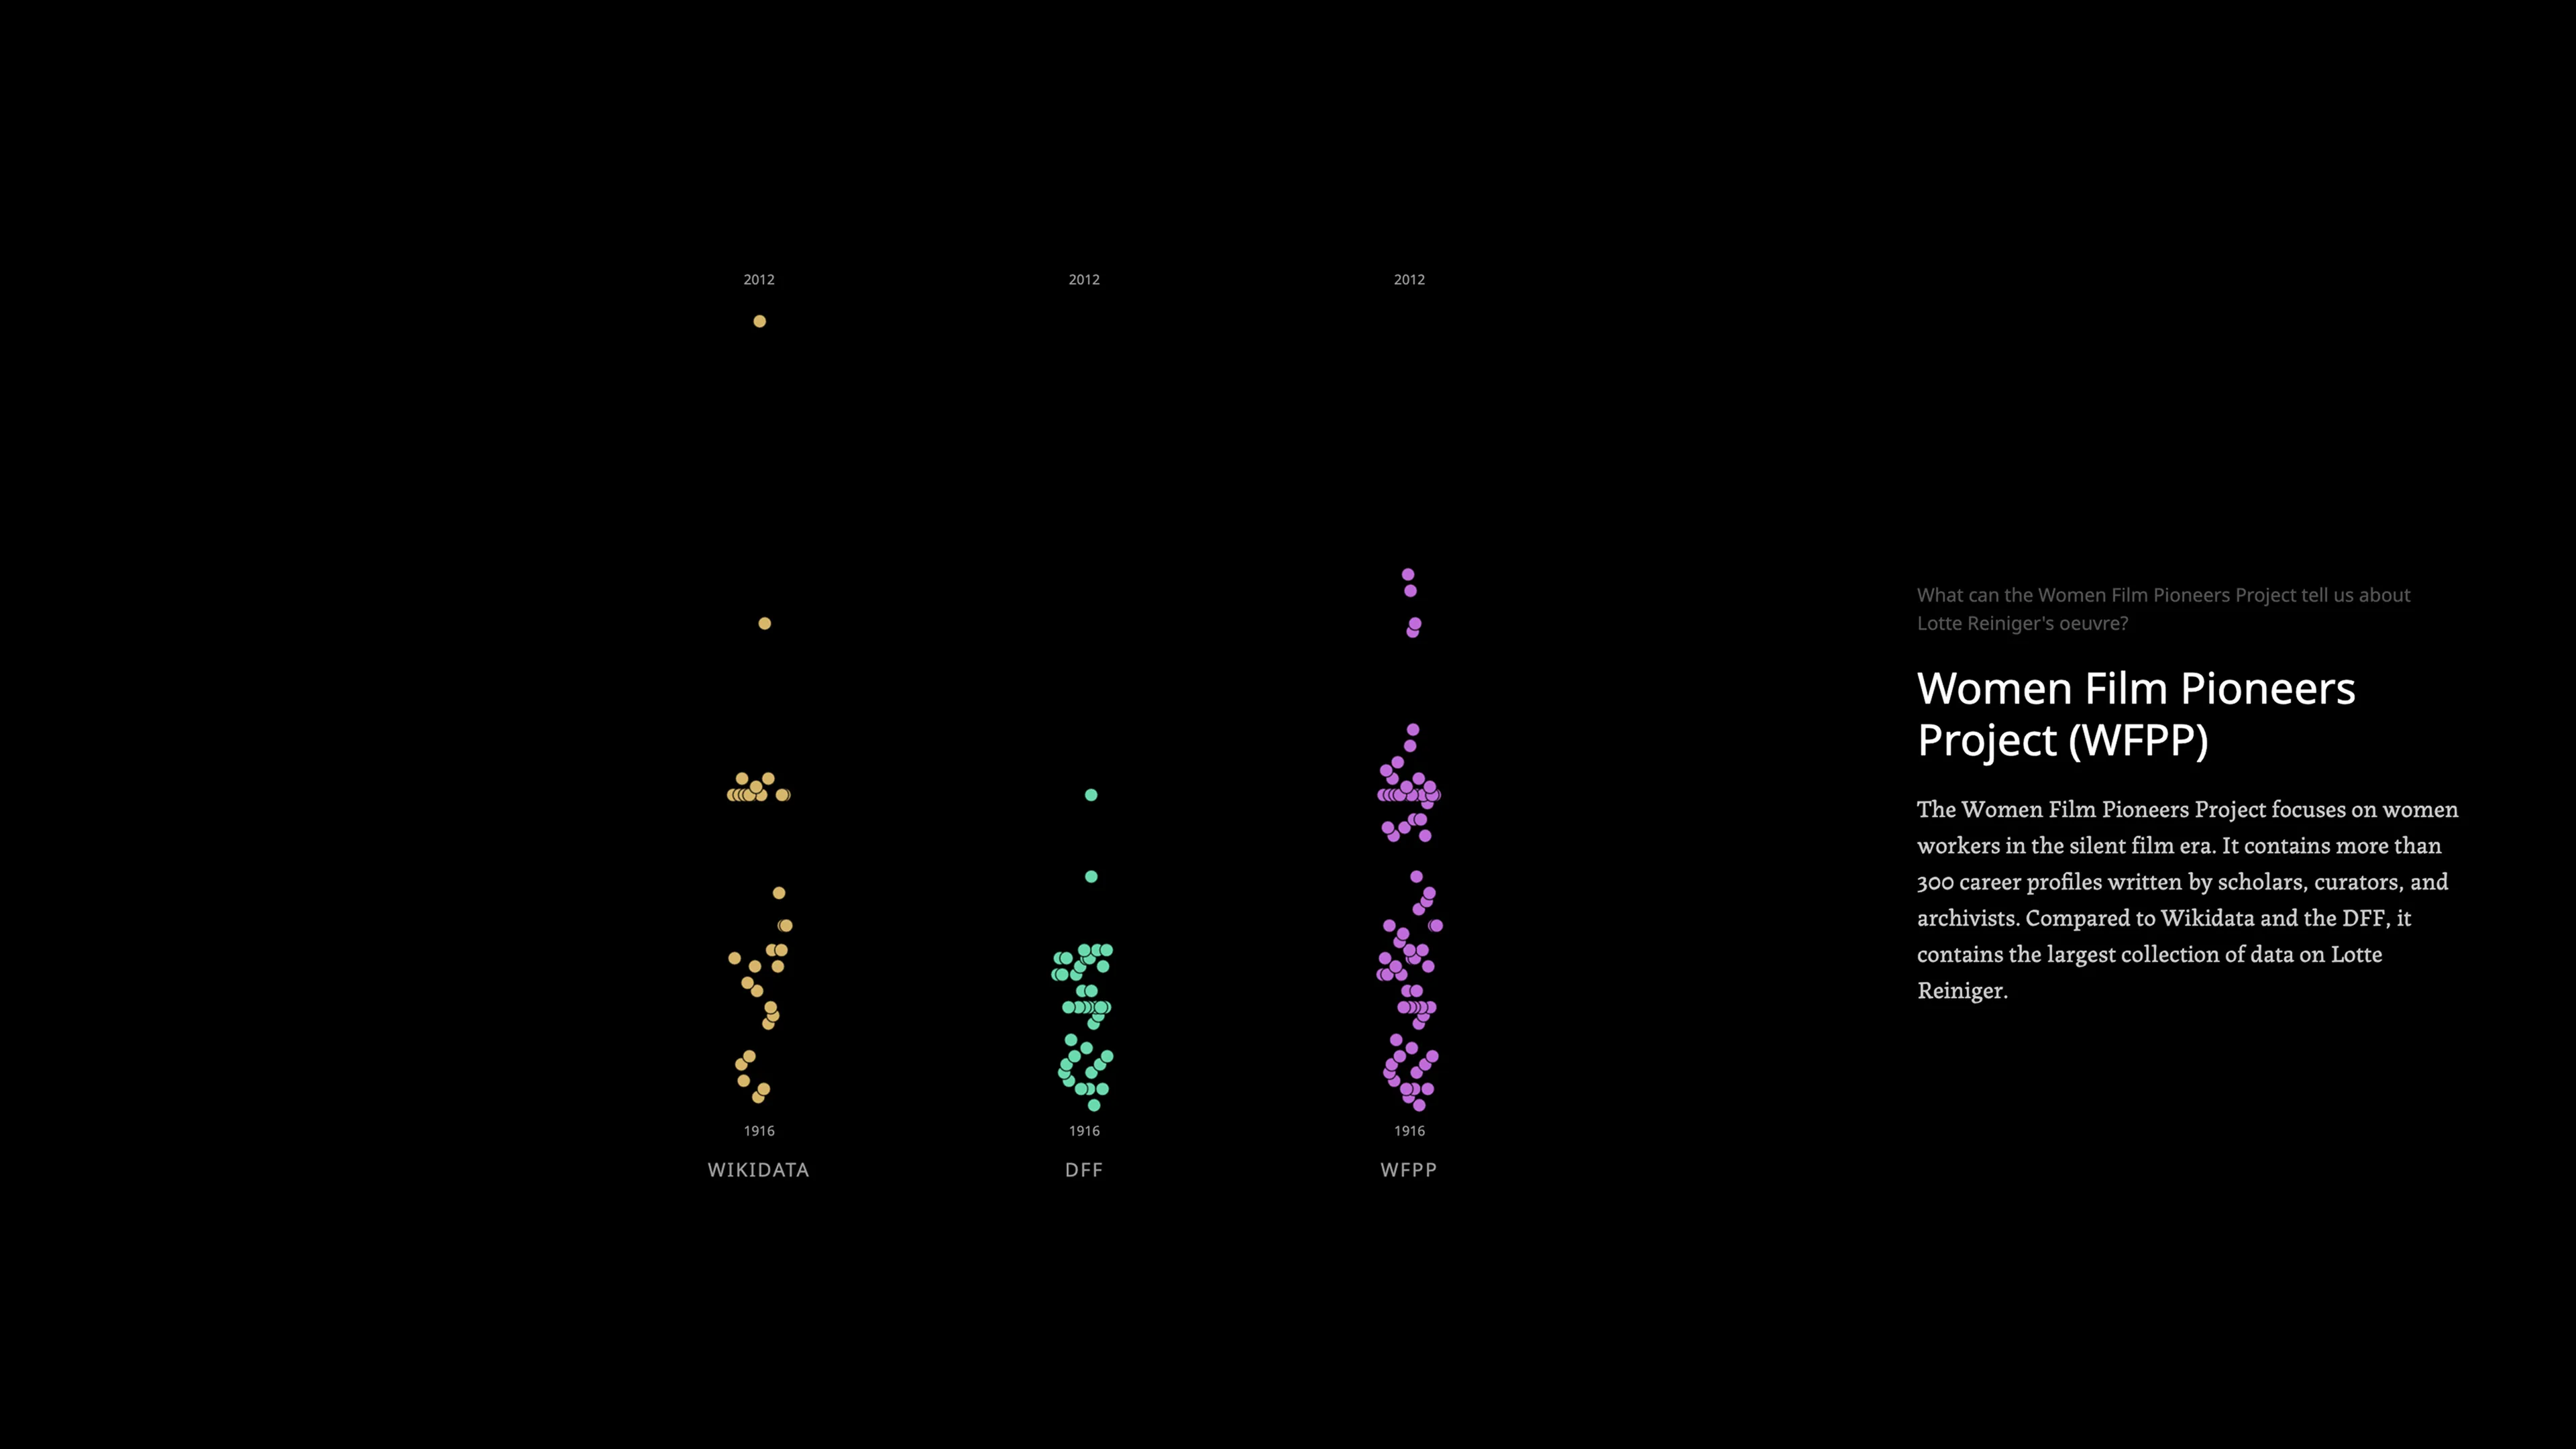
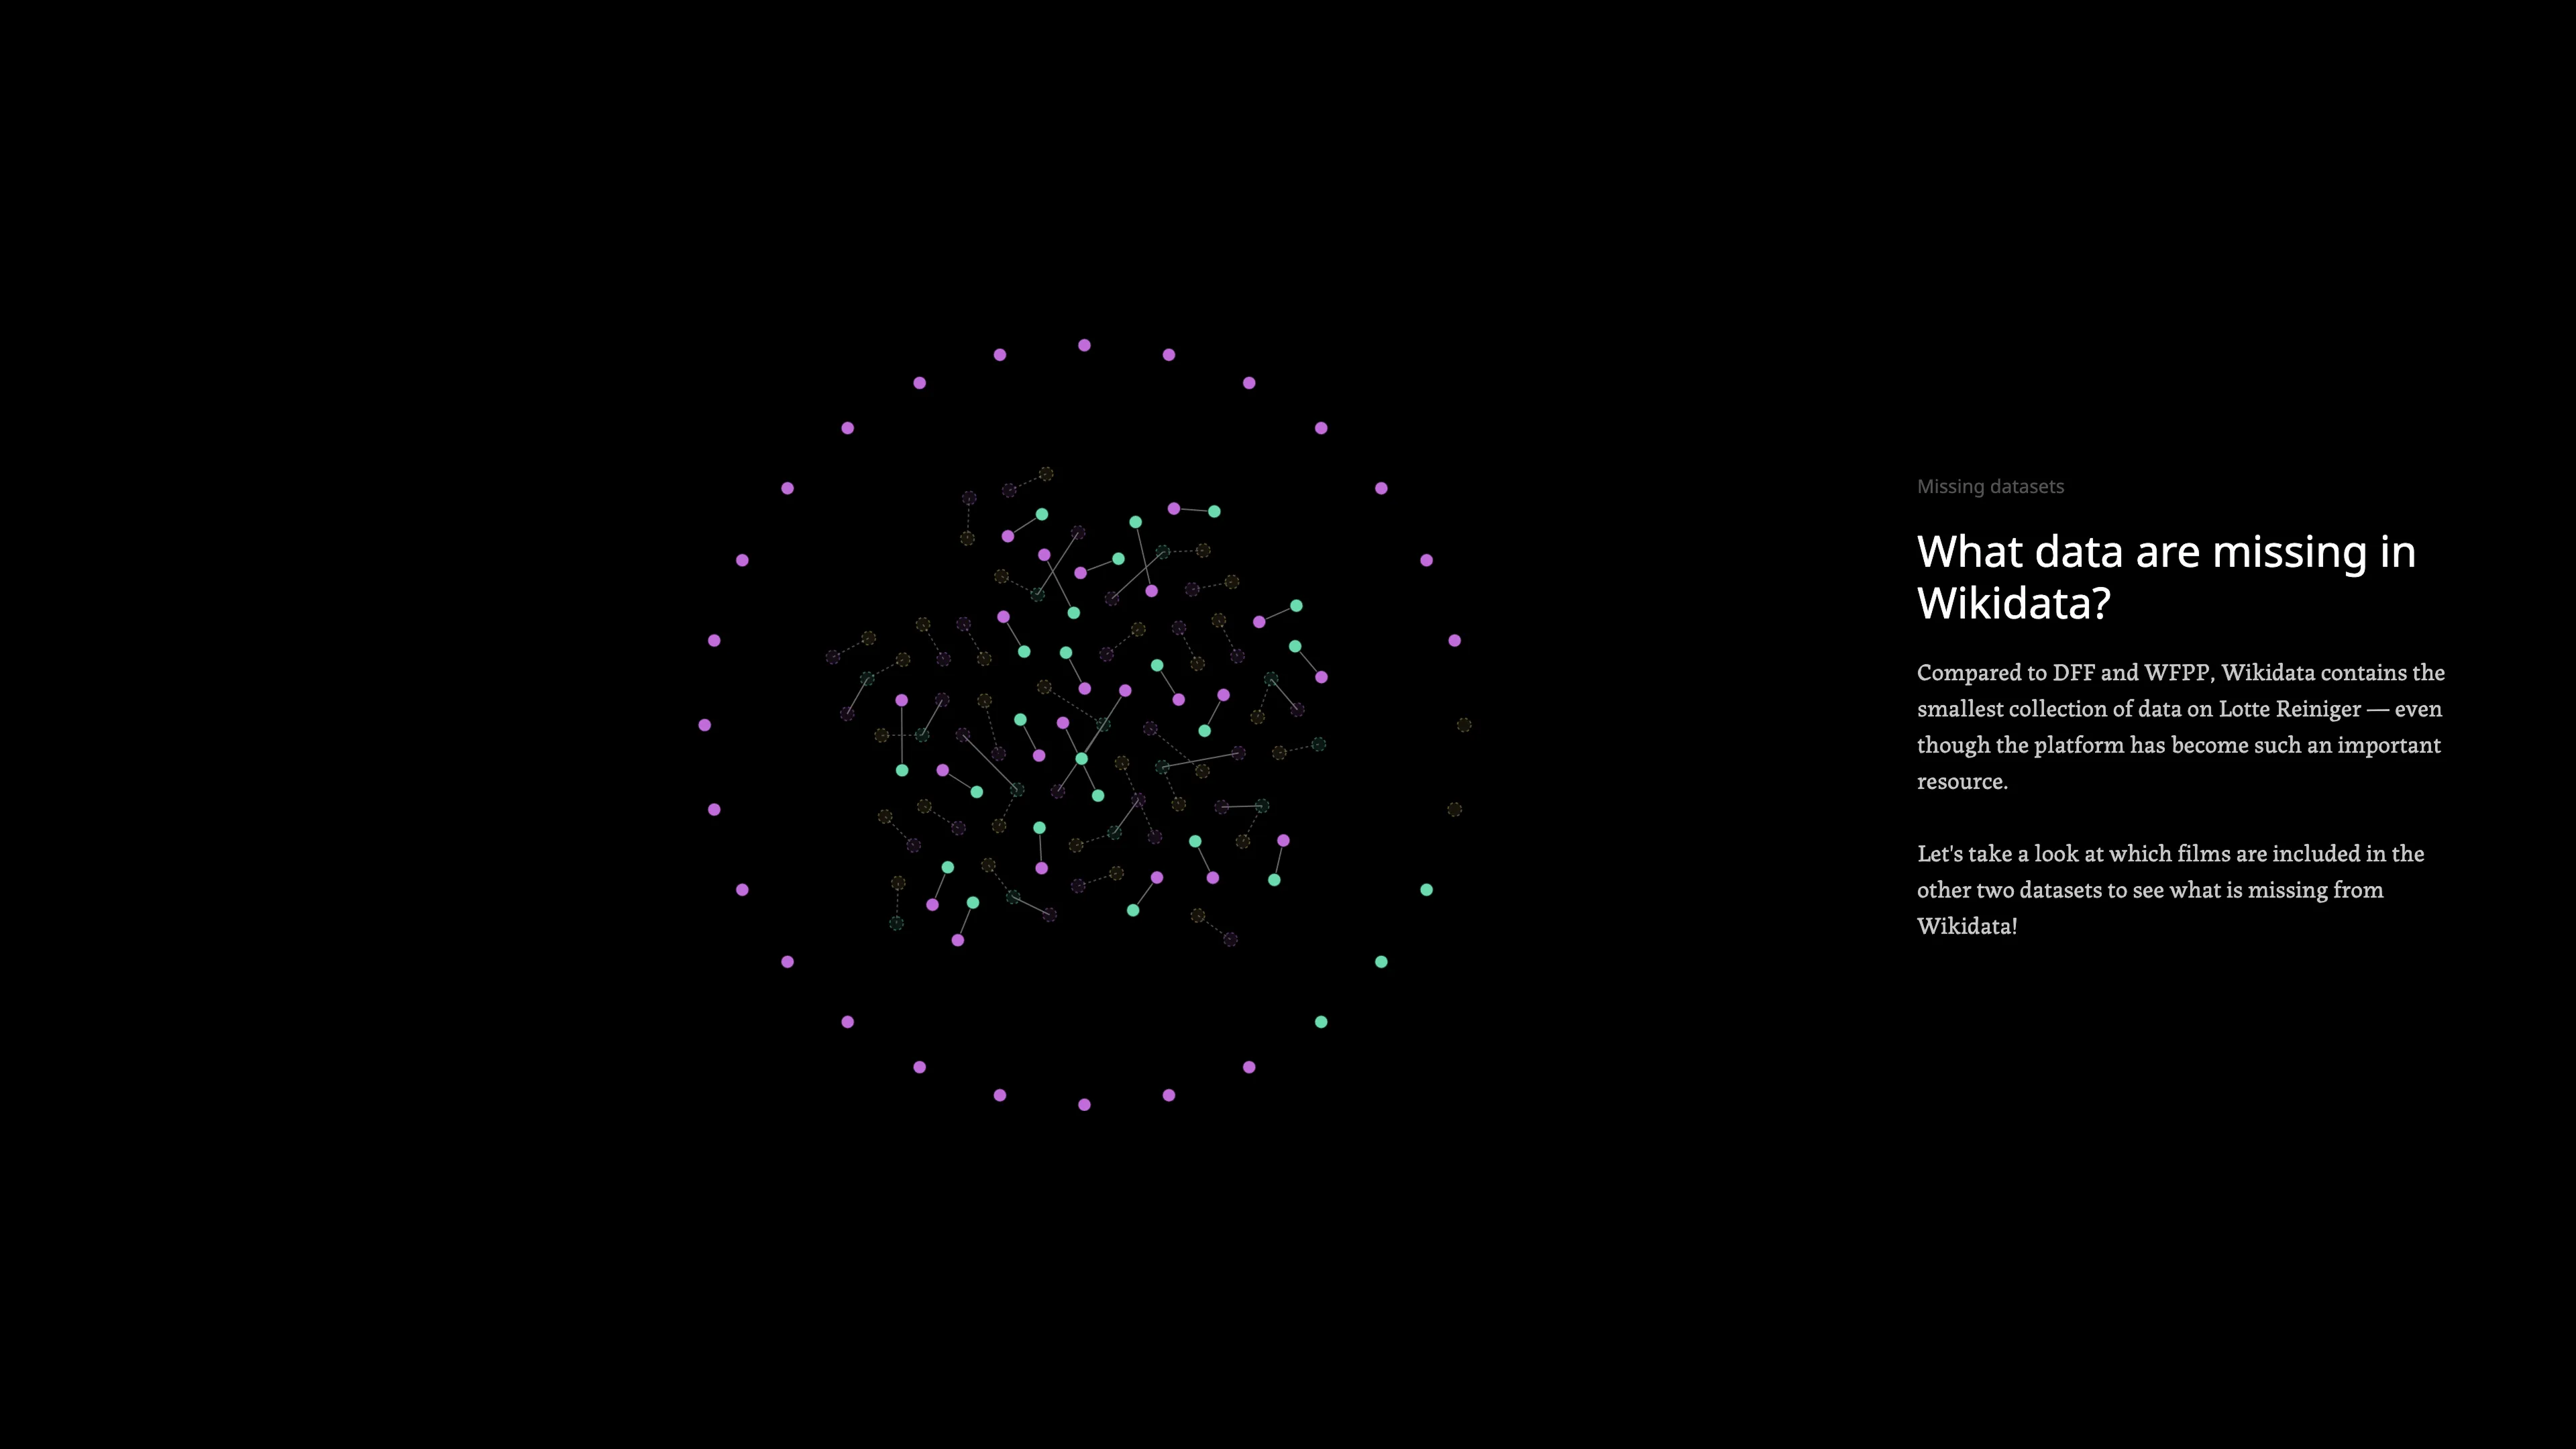
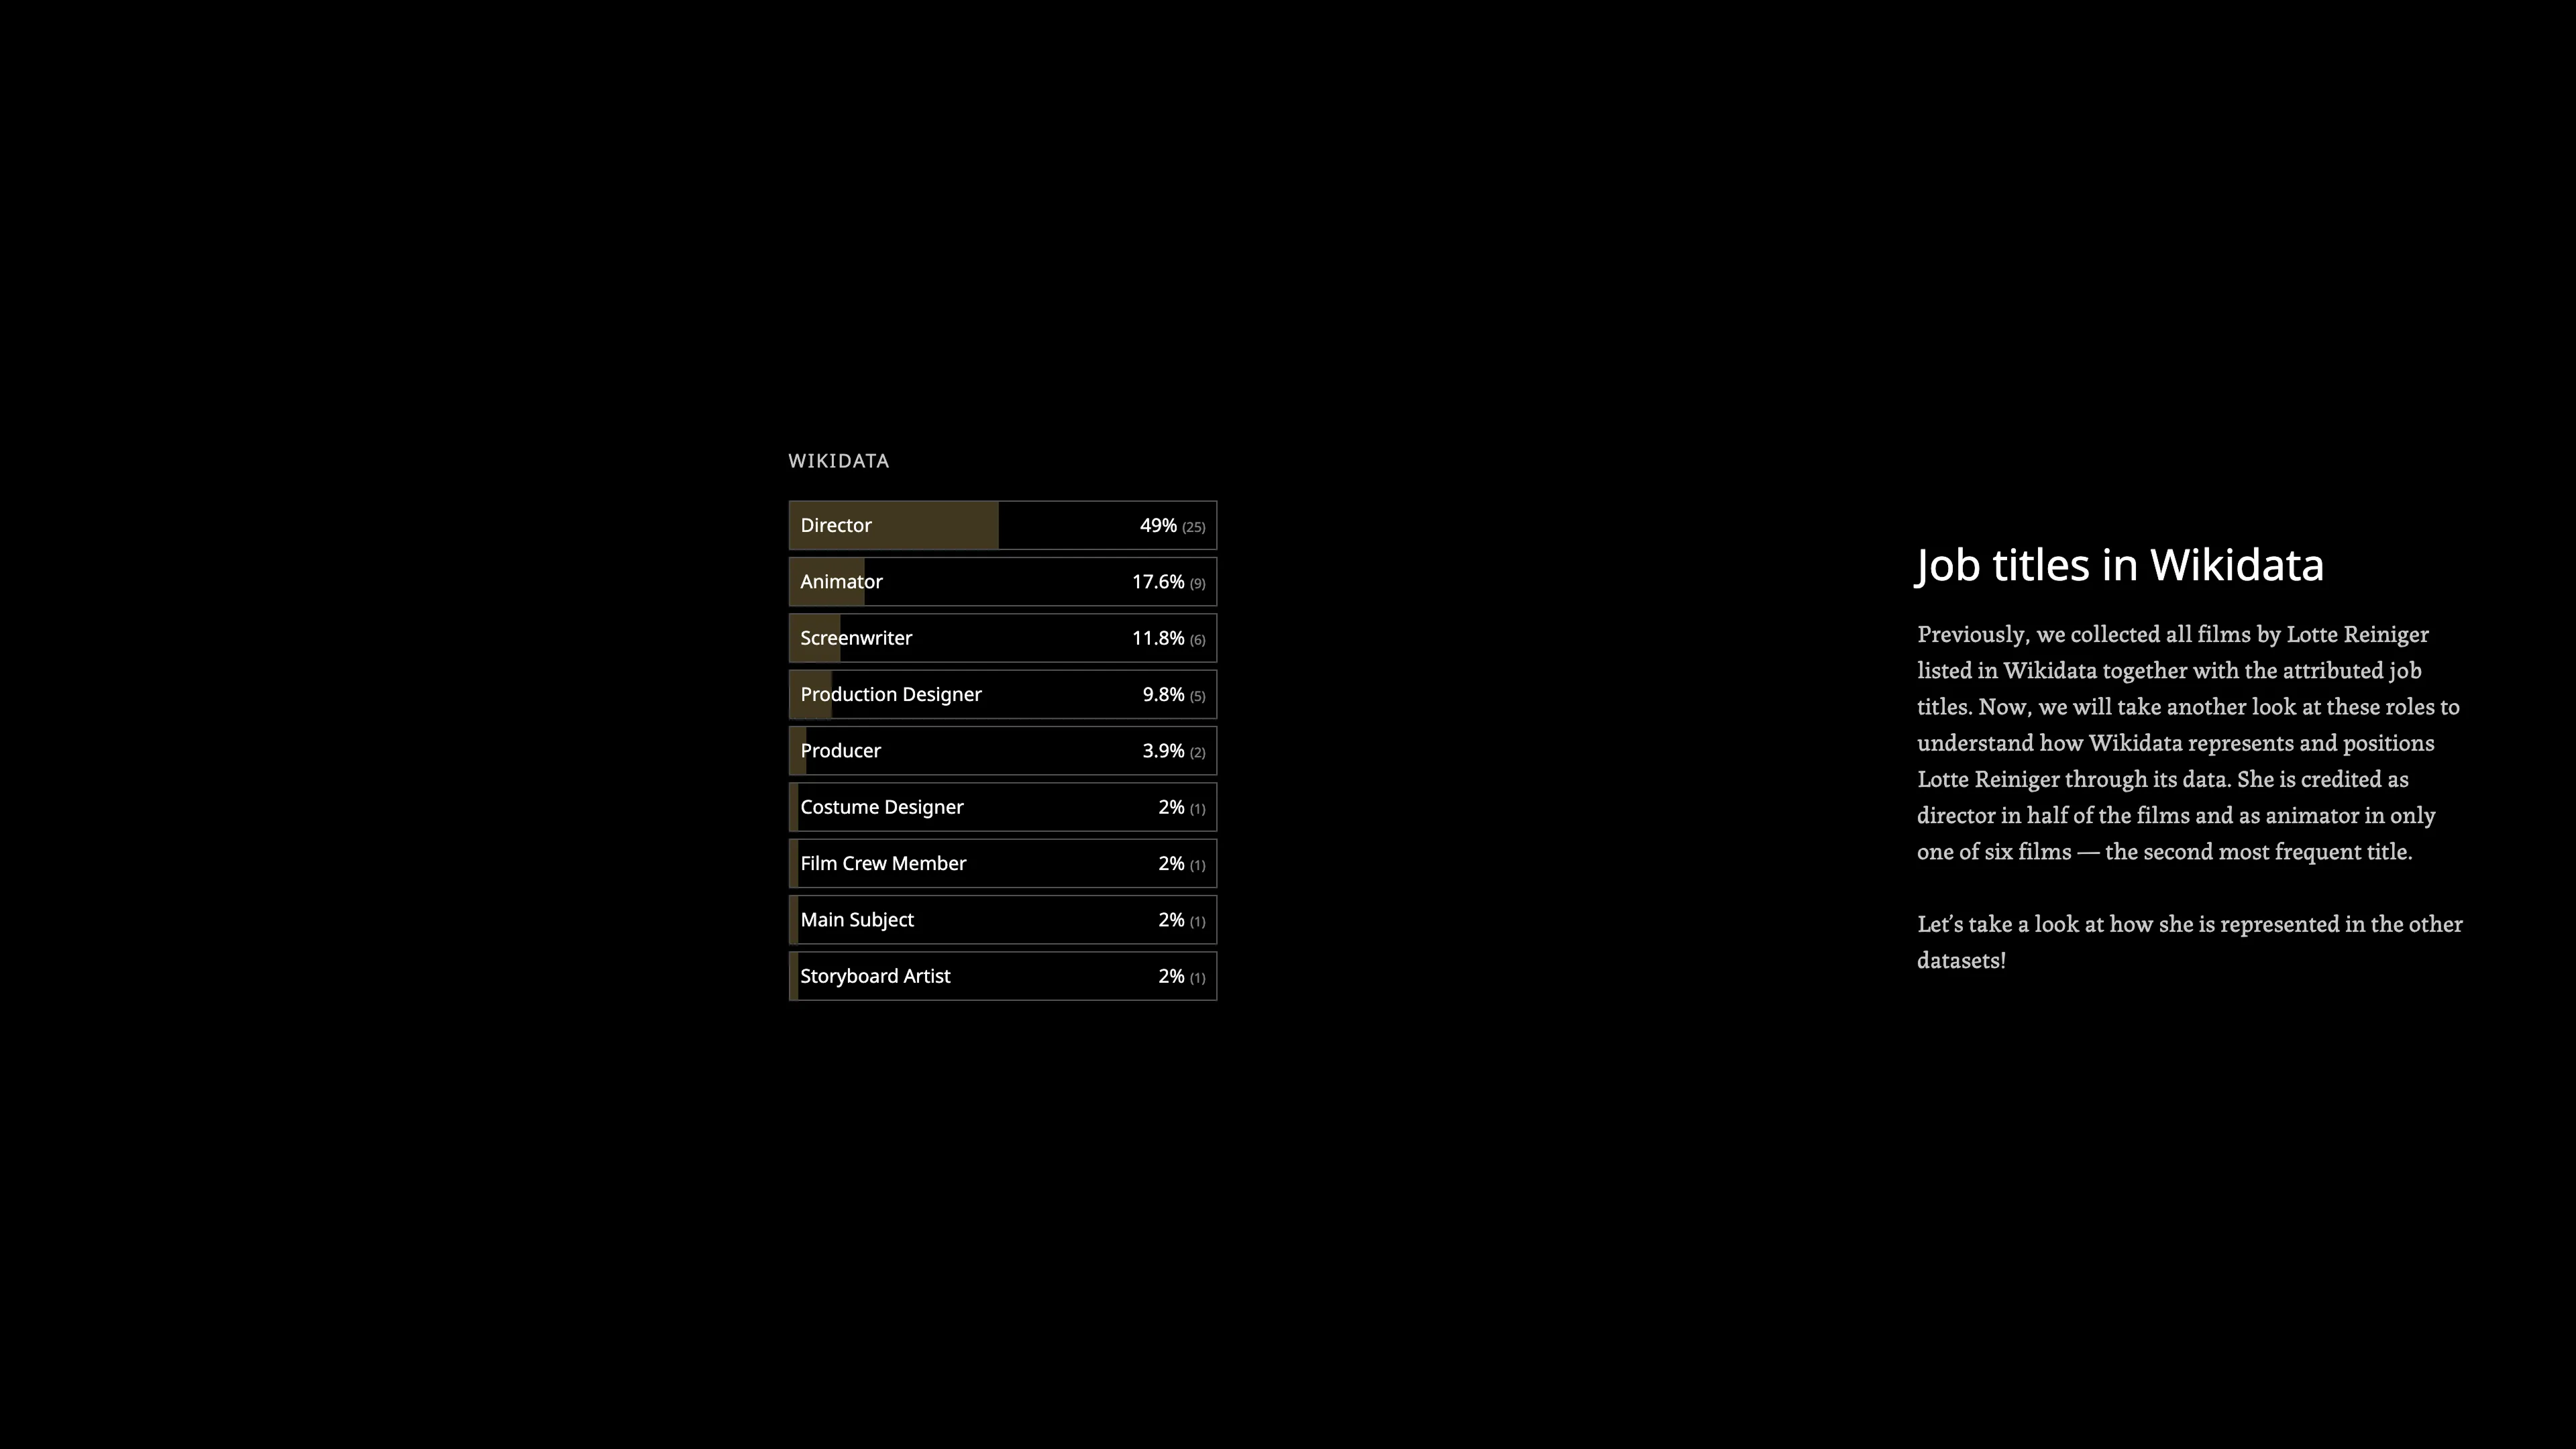
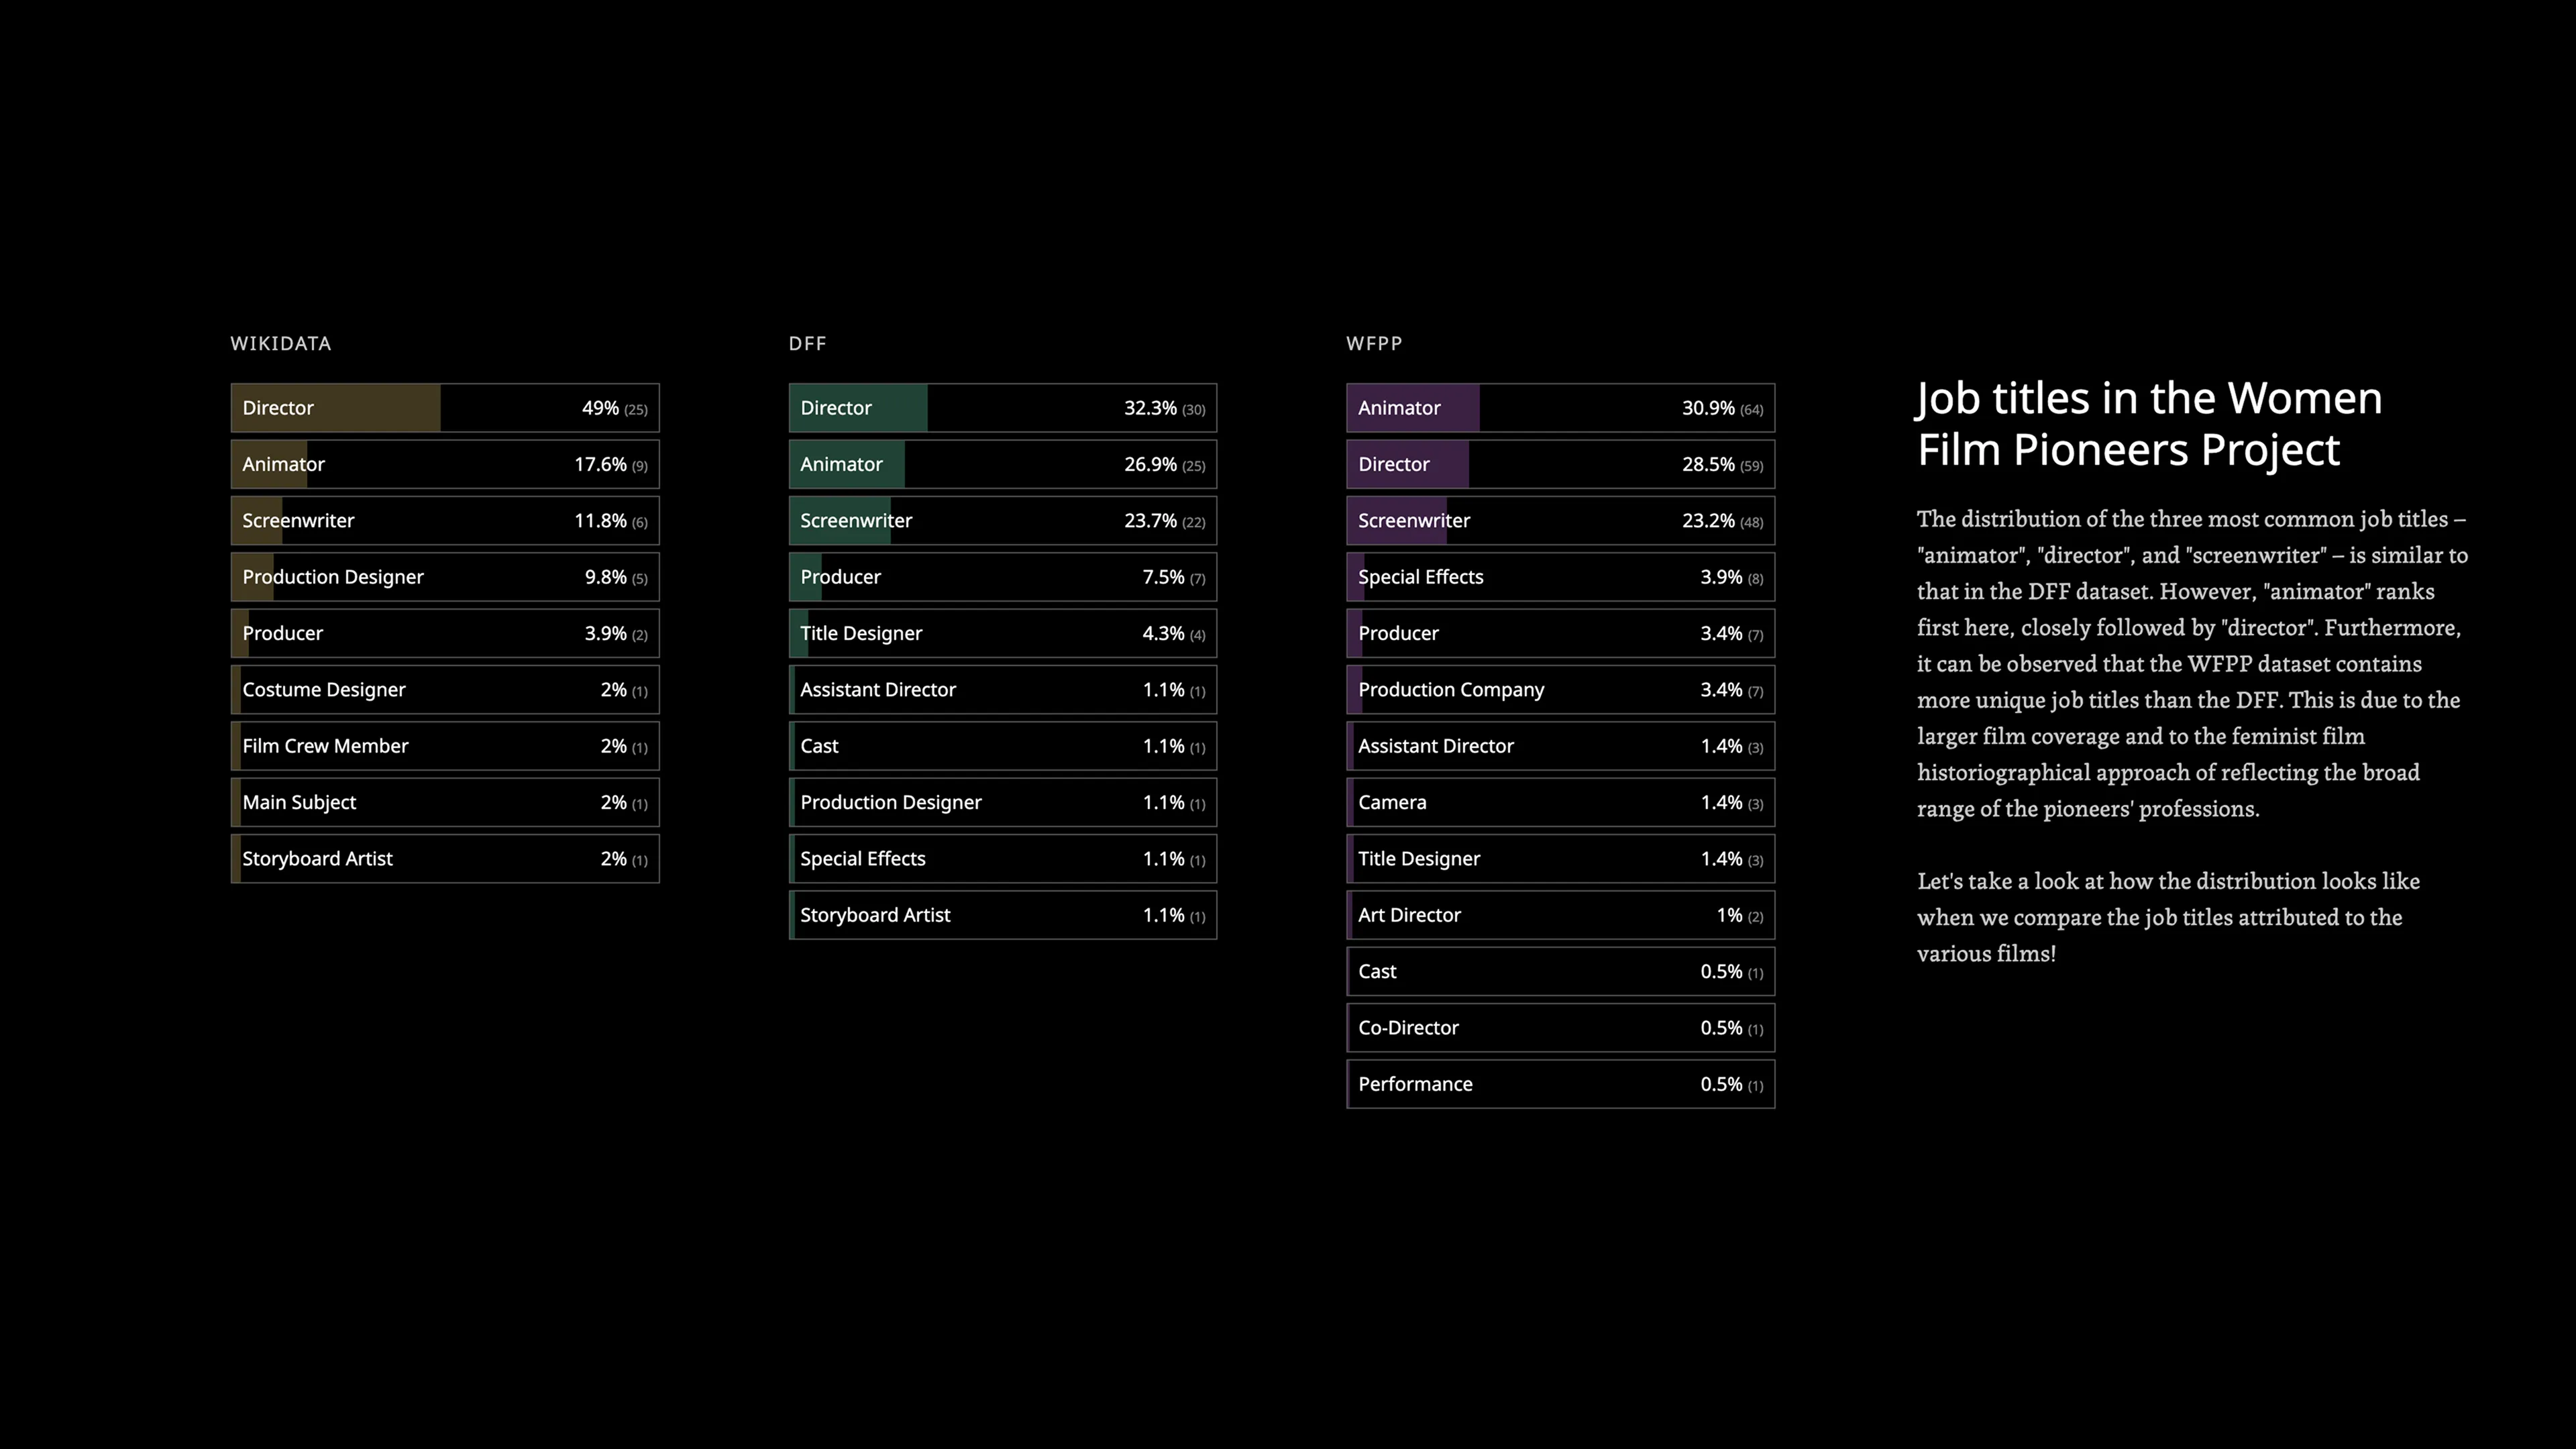
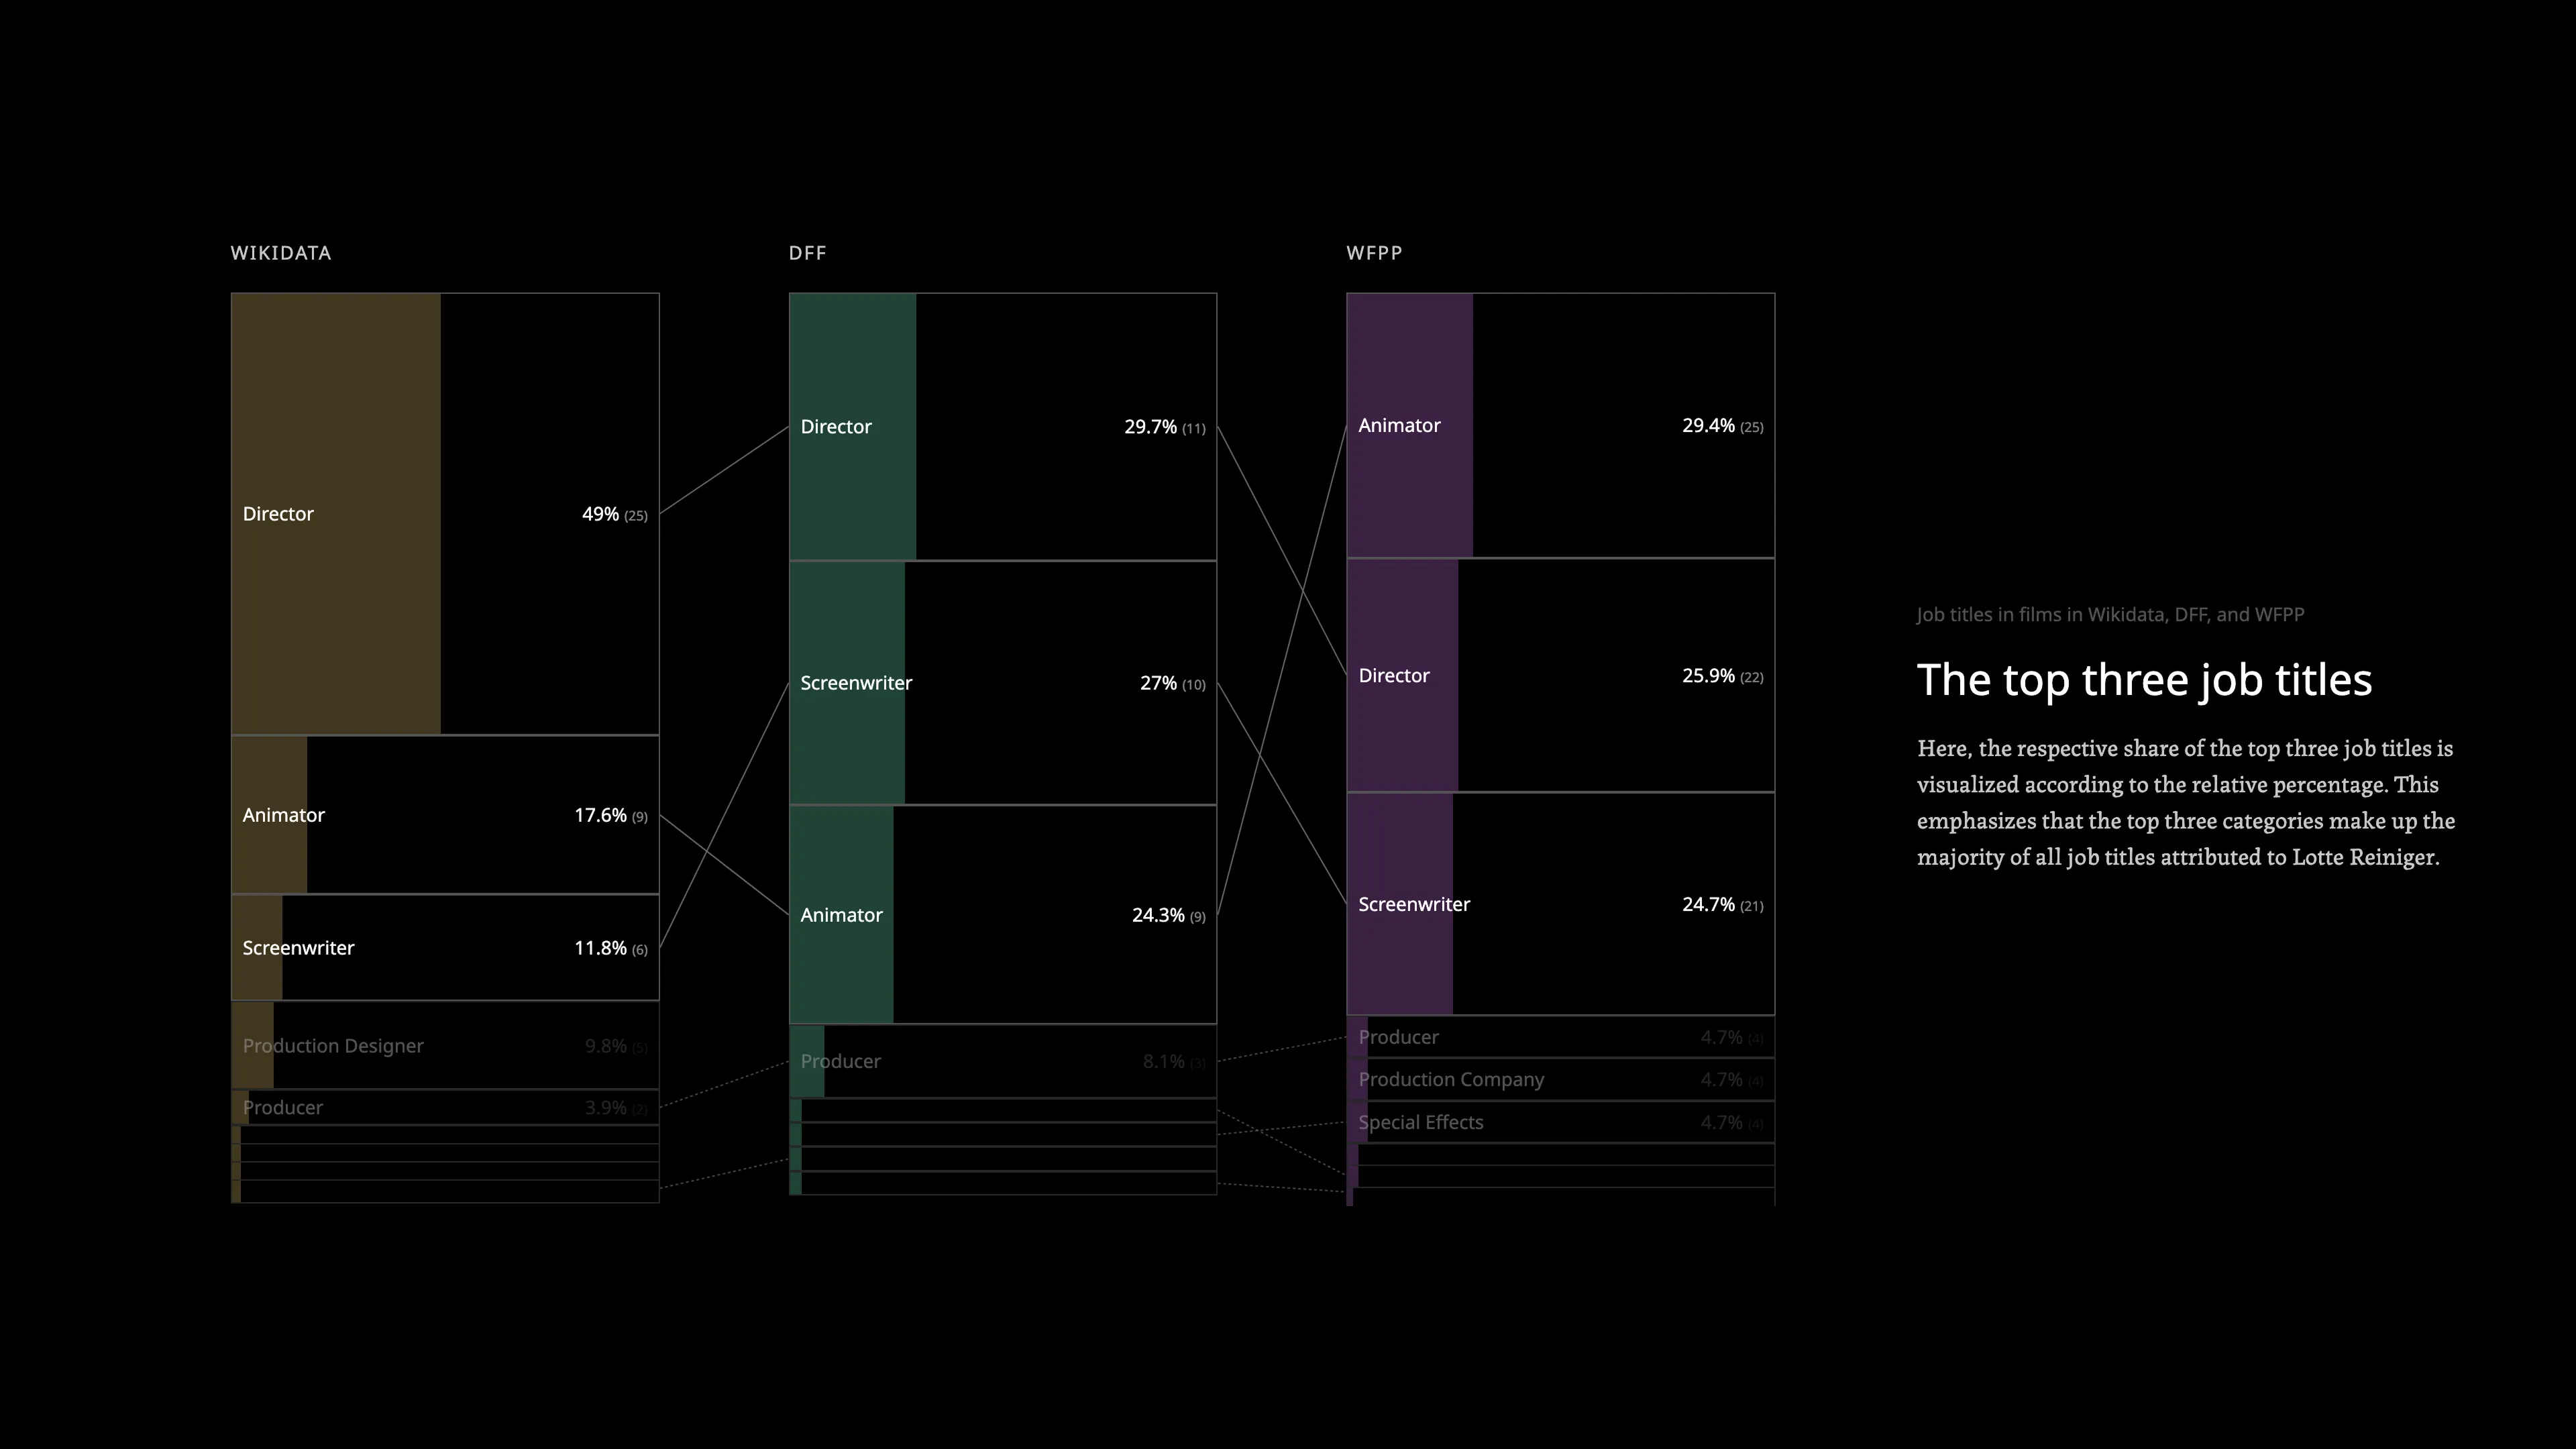
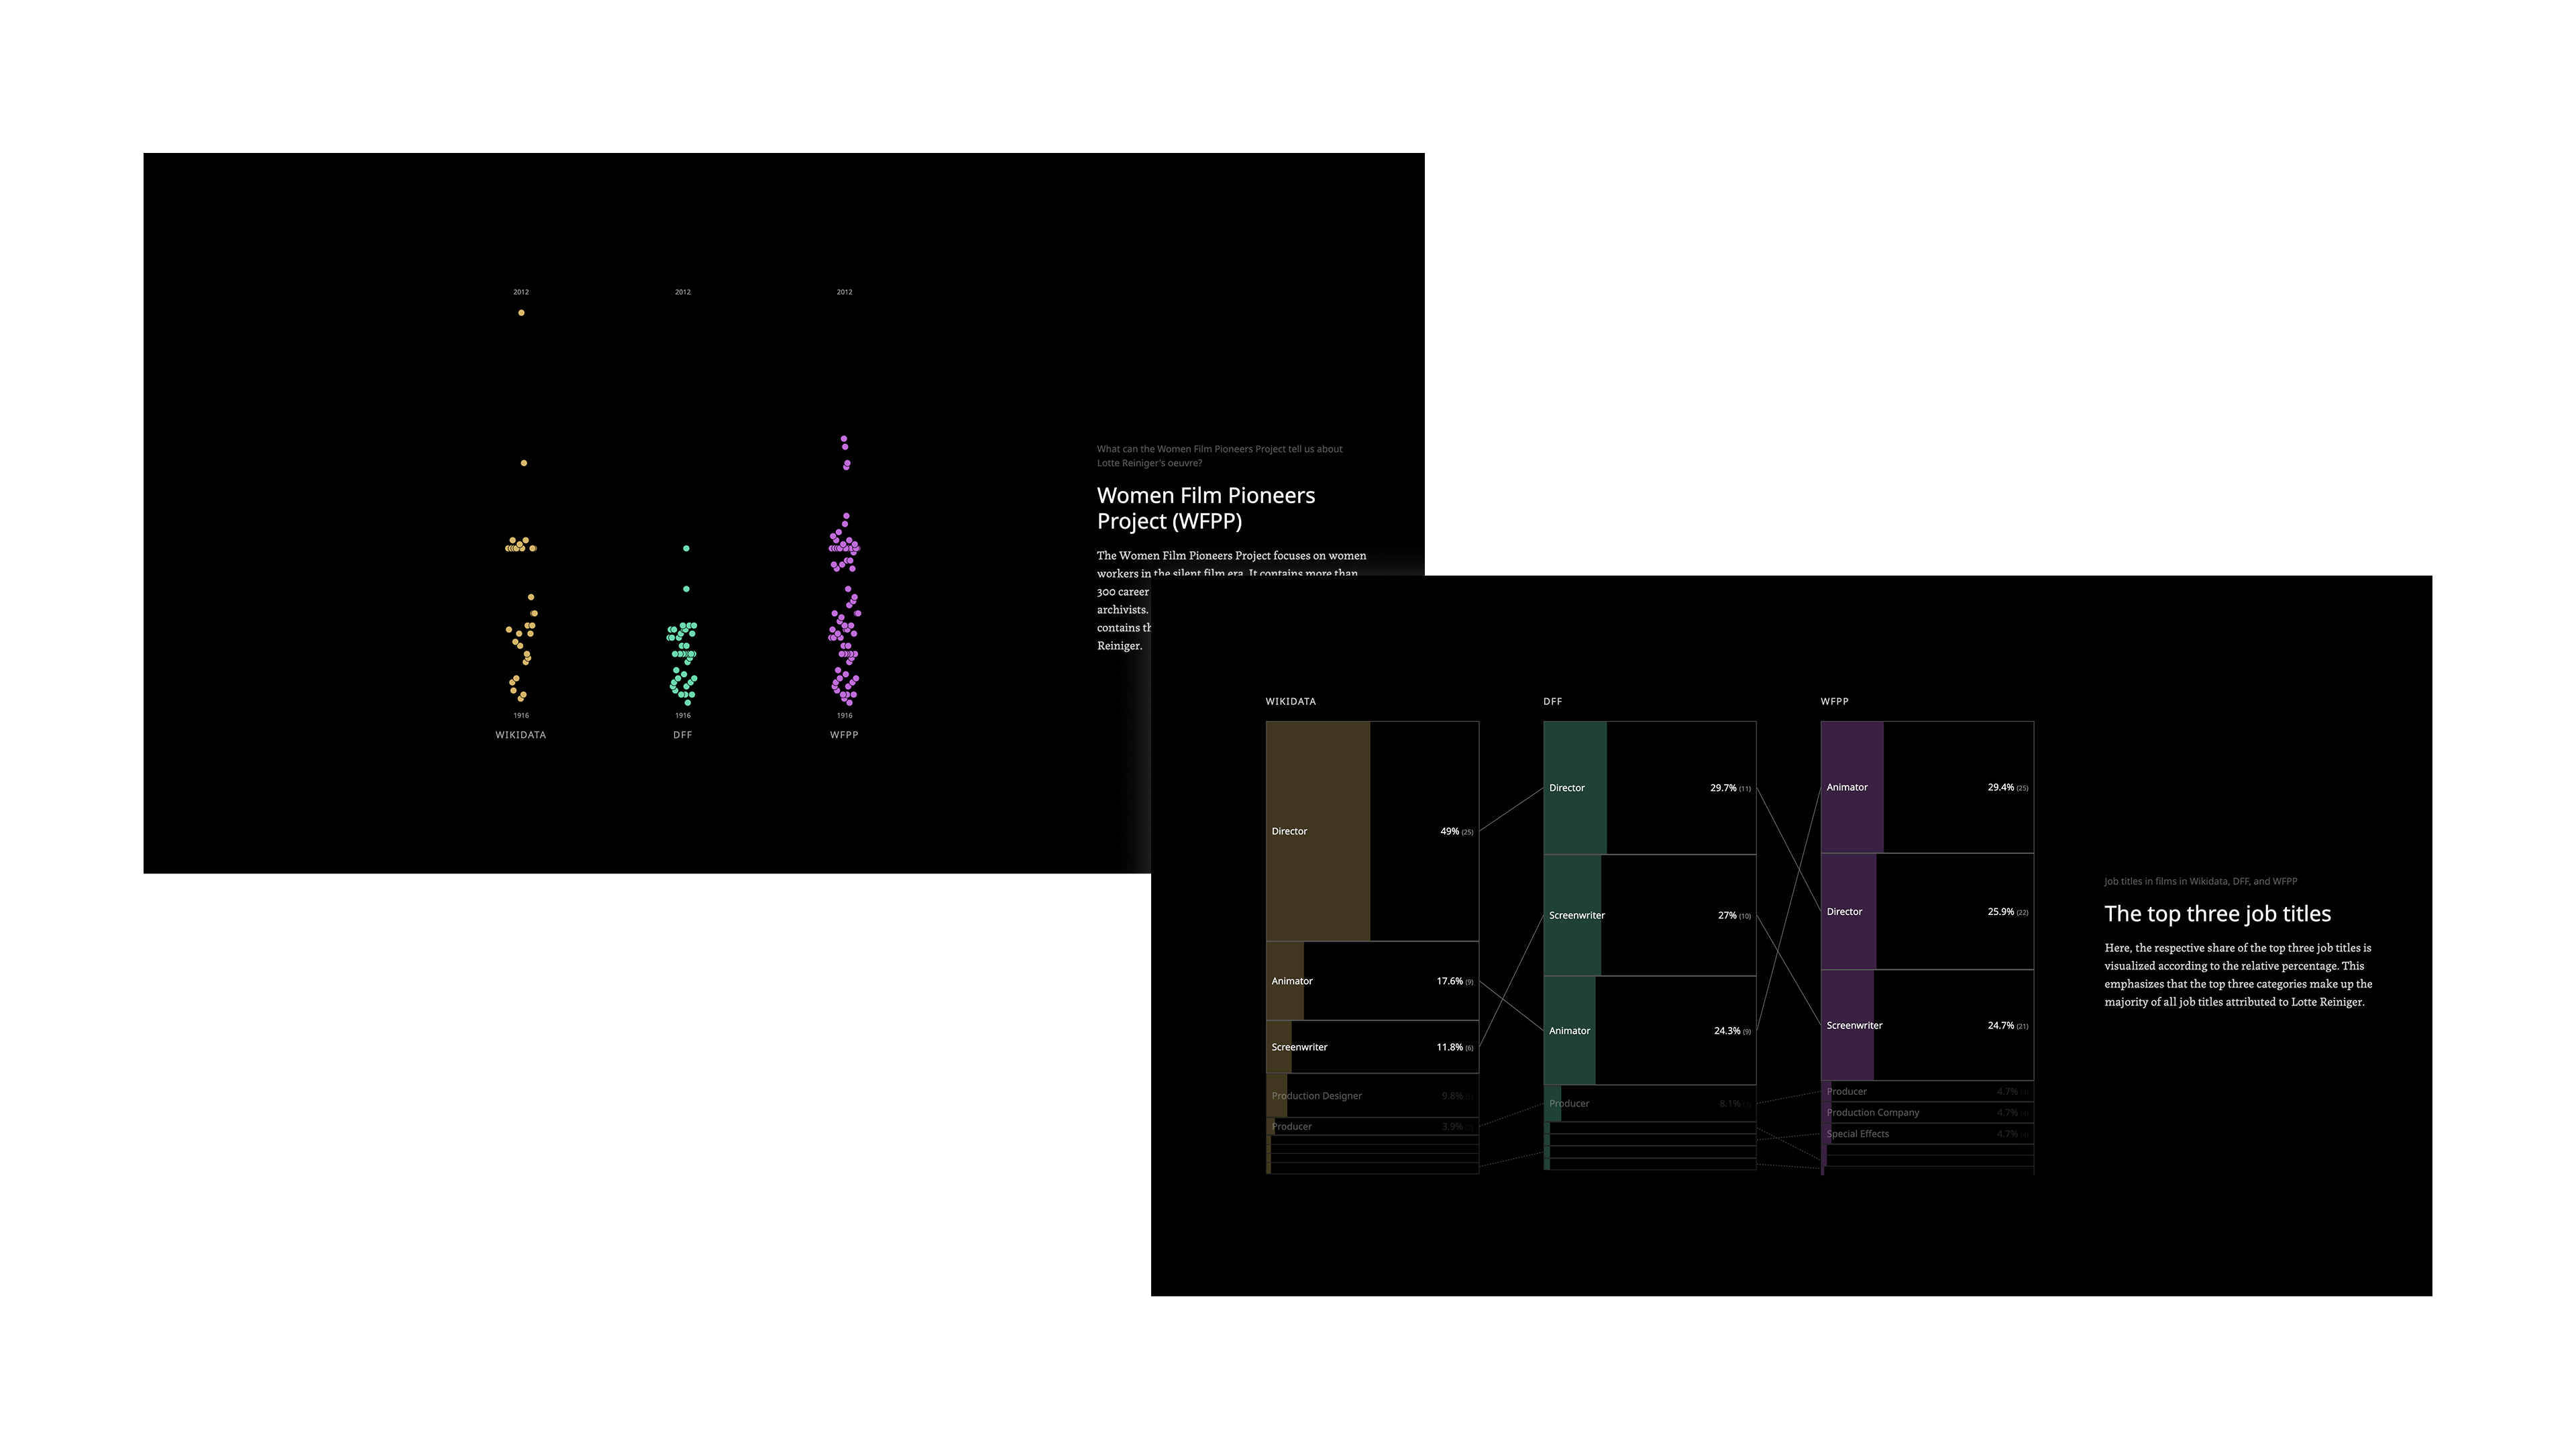
Before any narrative work, the three datasets were explored in SvelteKit using Observable Plot. This phase was about developing a genuine understanding of what the data contained and what tensions it held: which job titles appeared where, which films were missing, where normalization was needed. The earlier visualization work done by the research group provided a foundation, but the exploration was done fresh to find a story that had not already been told.
-
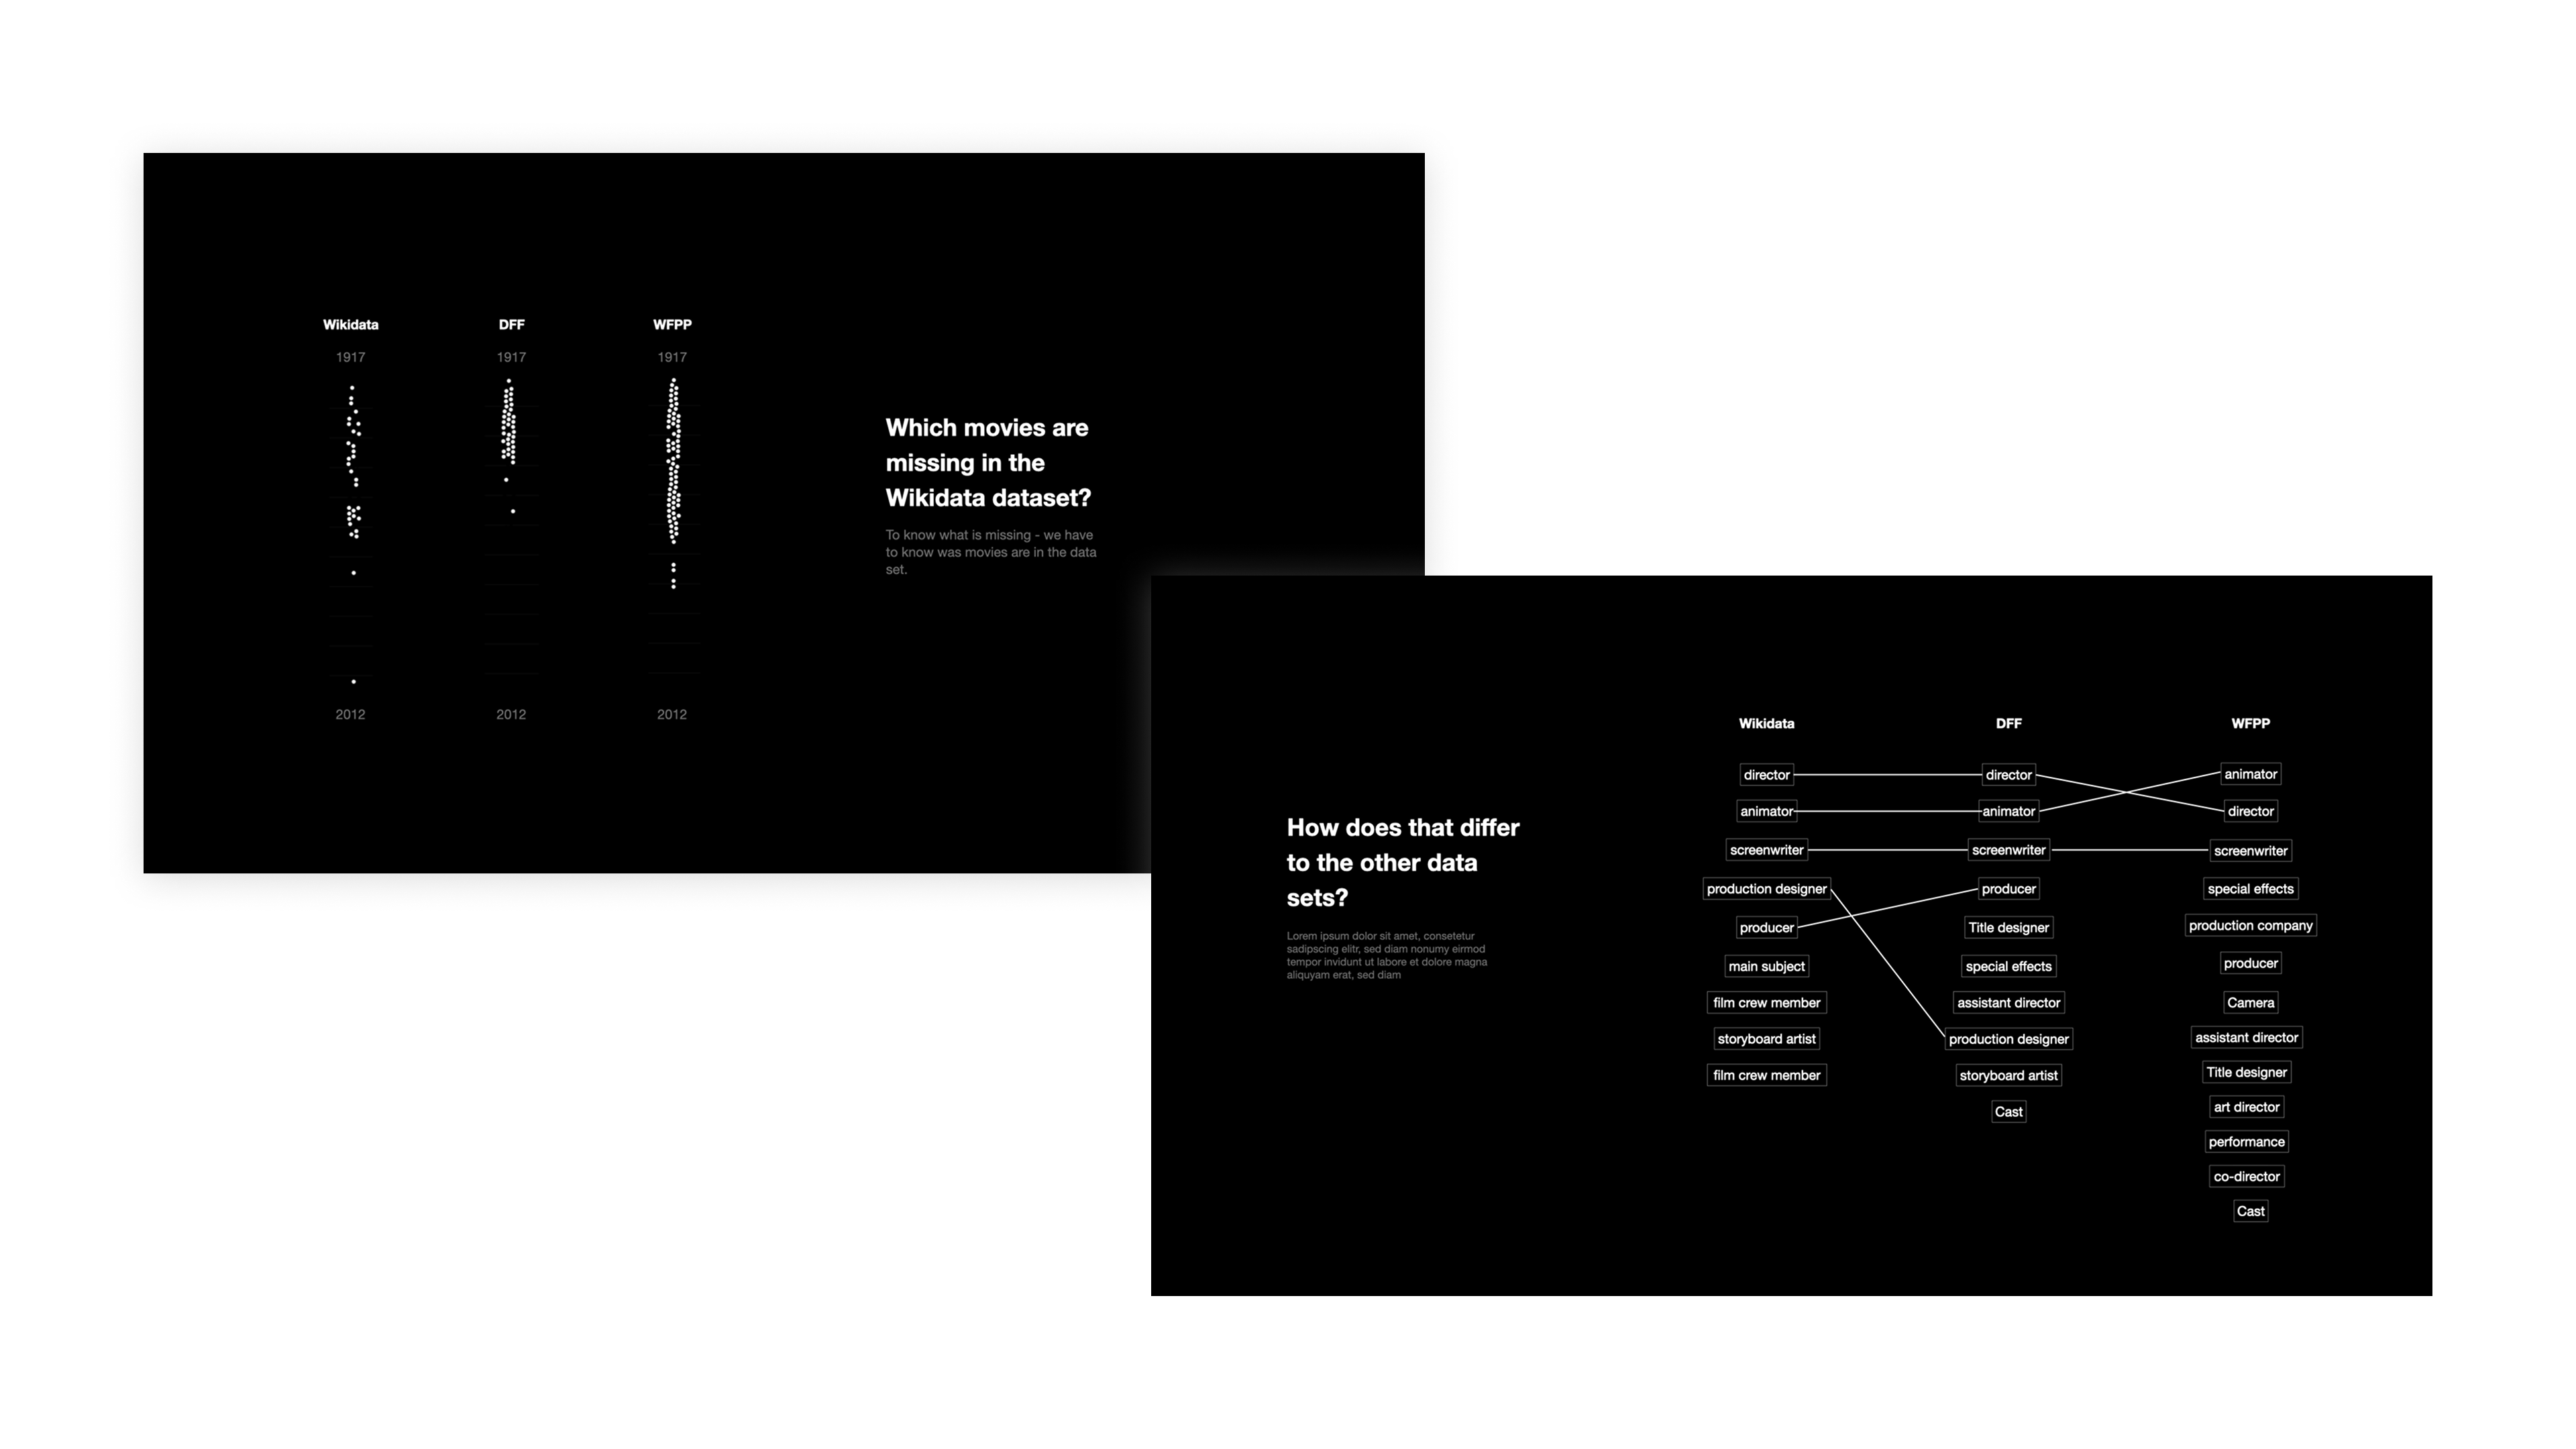
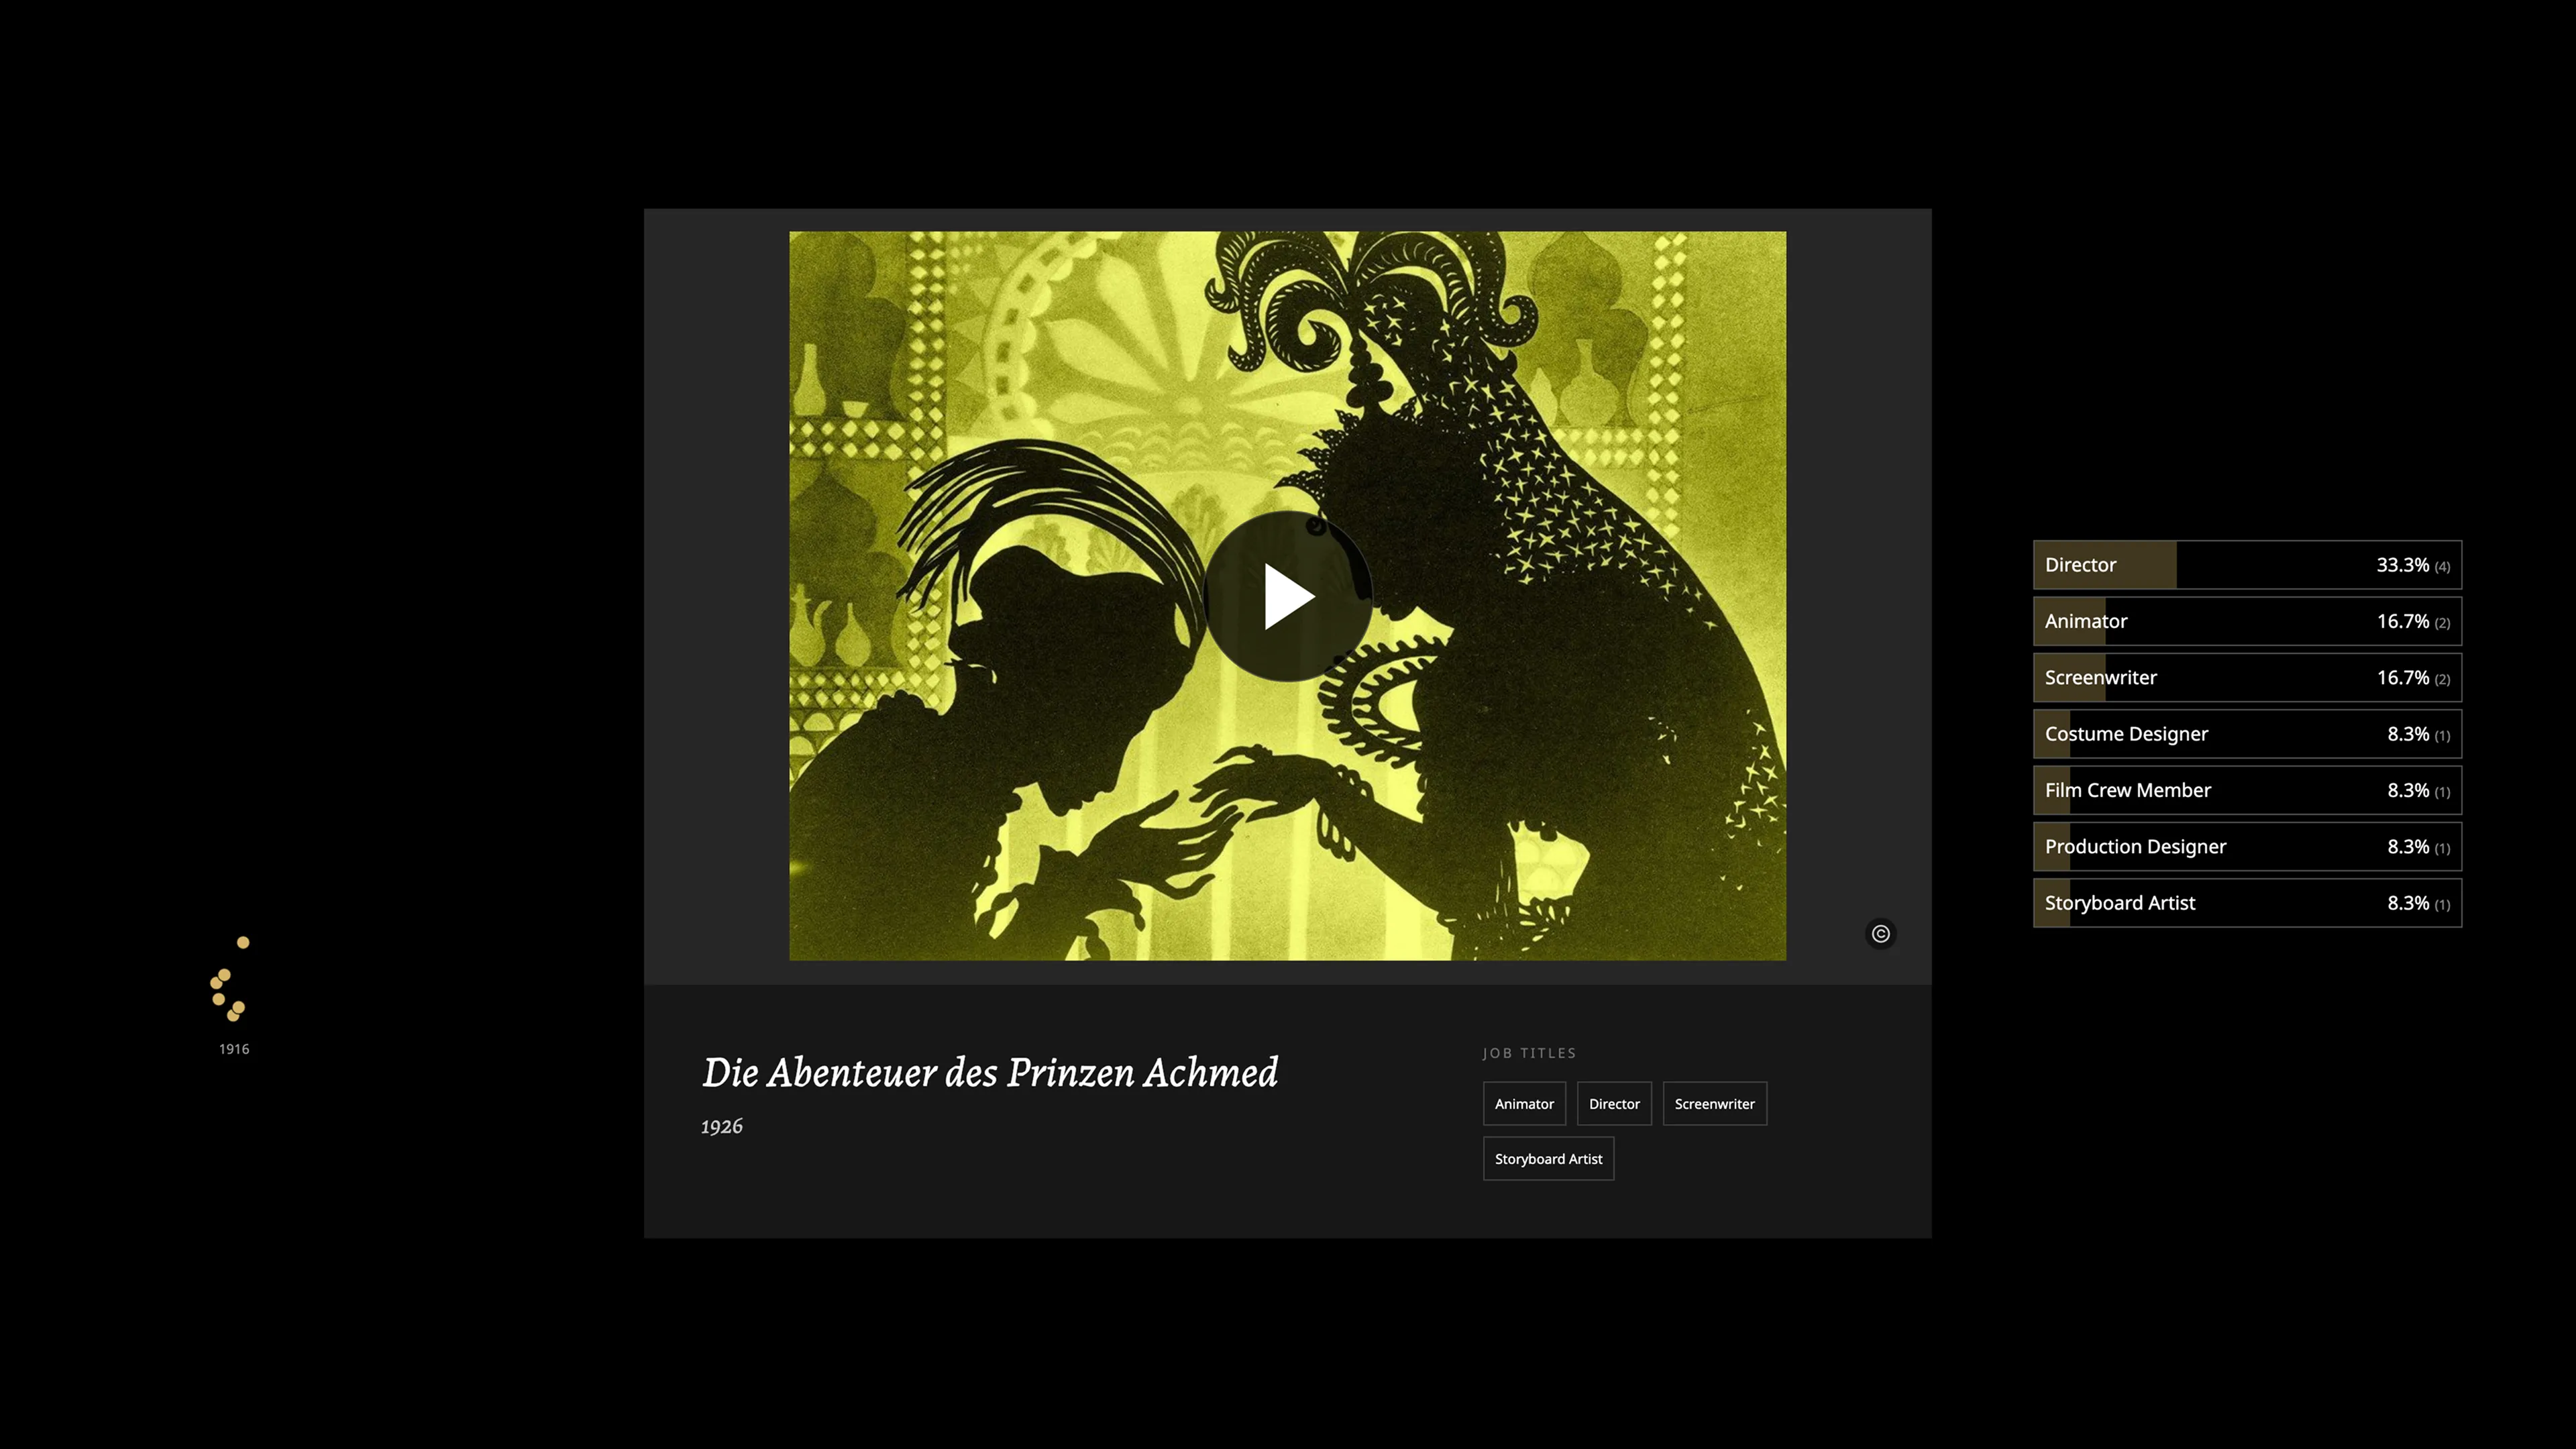
A slide deck translated the data exploration into a proposed story structure, sequencing the three dataset questions into a scrollytelling arc. This became the tool for aligning with Sarah-Mai Dang on the narrative direction before any production began. The key editorial decisions, to focus on one person, show the art not just the metadata, and let absence do the argumentative work, were established in this phase.
-
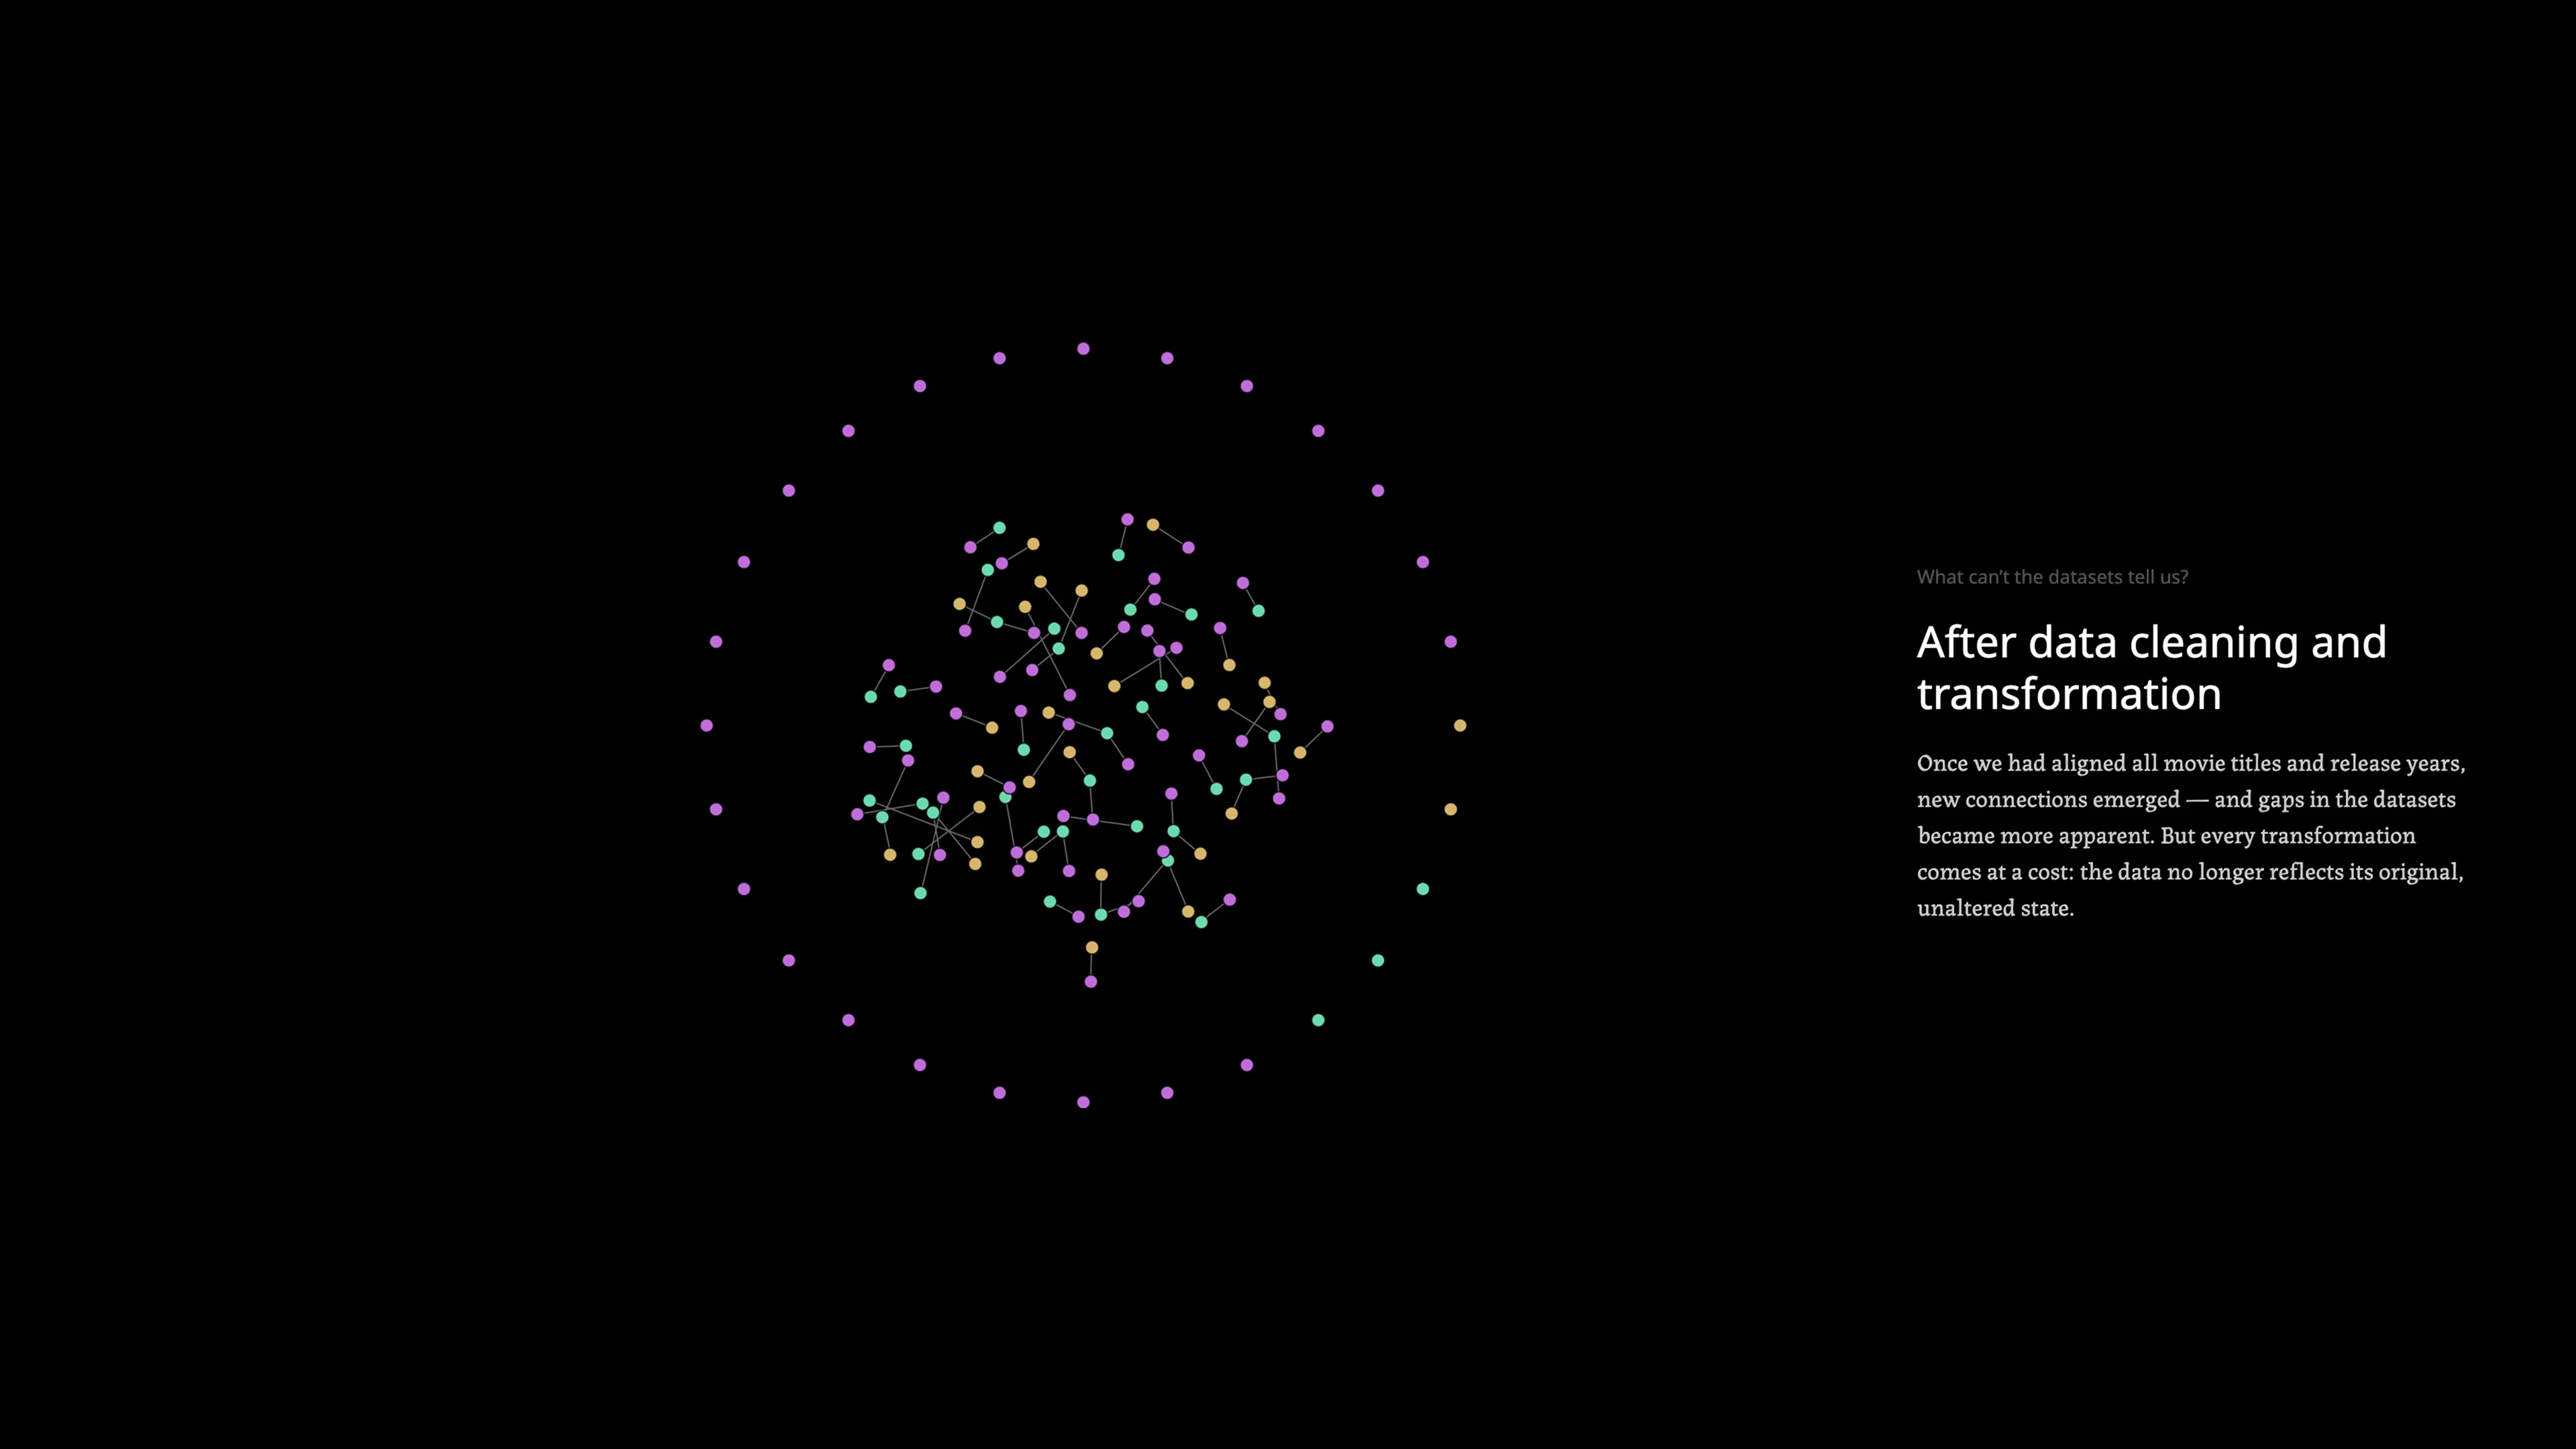
The final site required building in stages: data normalization, Canvas animation, D3 chart components, and the SvelteKit architecture, with the full visual quality only visible close to launch. Working with a research partner who understood and trusted the iterative process made it possible to keep refining the work until it said what it needed to say.
Impact
Published research reaching the right audience at launch
The project launched in May 2026 as the third and final data visualization output of the BMFTR Research Group DAVIF, funded by the German Federal Ministry of Research, Technology and Space. Within days of publication, Sarah-Mai Dang's LinkedIn post reached film studies professors, museum directors, archive heads, and digital humanities researchers across Europe and North America, including engagement from Lev Manovich, whose comment noted the rarity of a data visualization that asks critical questions about its own datasets rather than simply presenting them. The audience reaction confirmed the core editorial decision: showing Reiniger's art alongside the metadata analysis made the argument land for people who care about both film history and data practice.
Project in numbers
Learnings
Data visualization can hide as much as it reveals
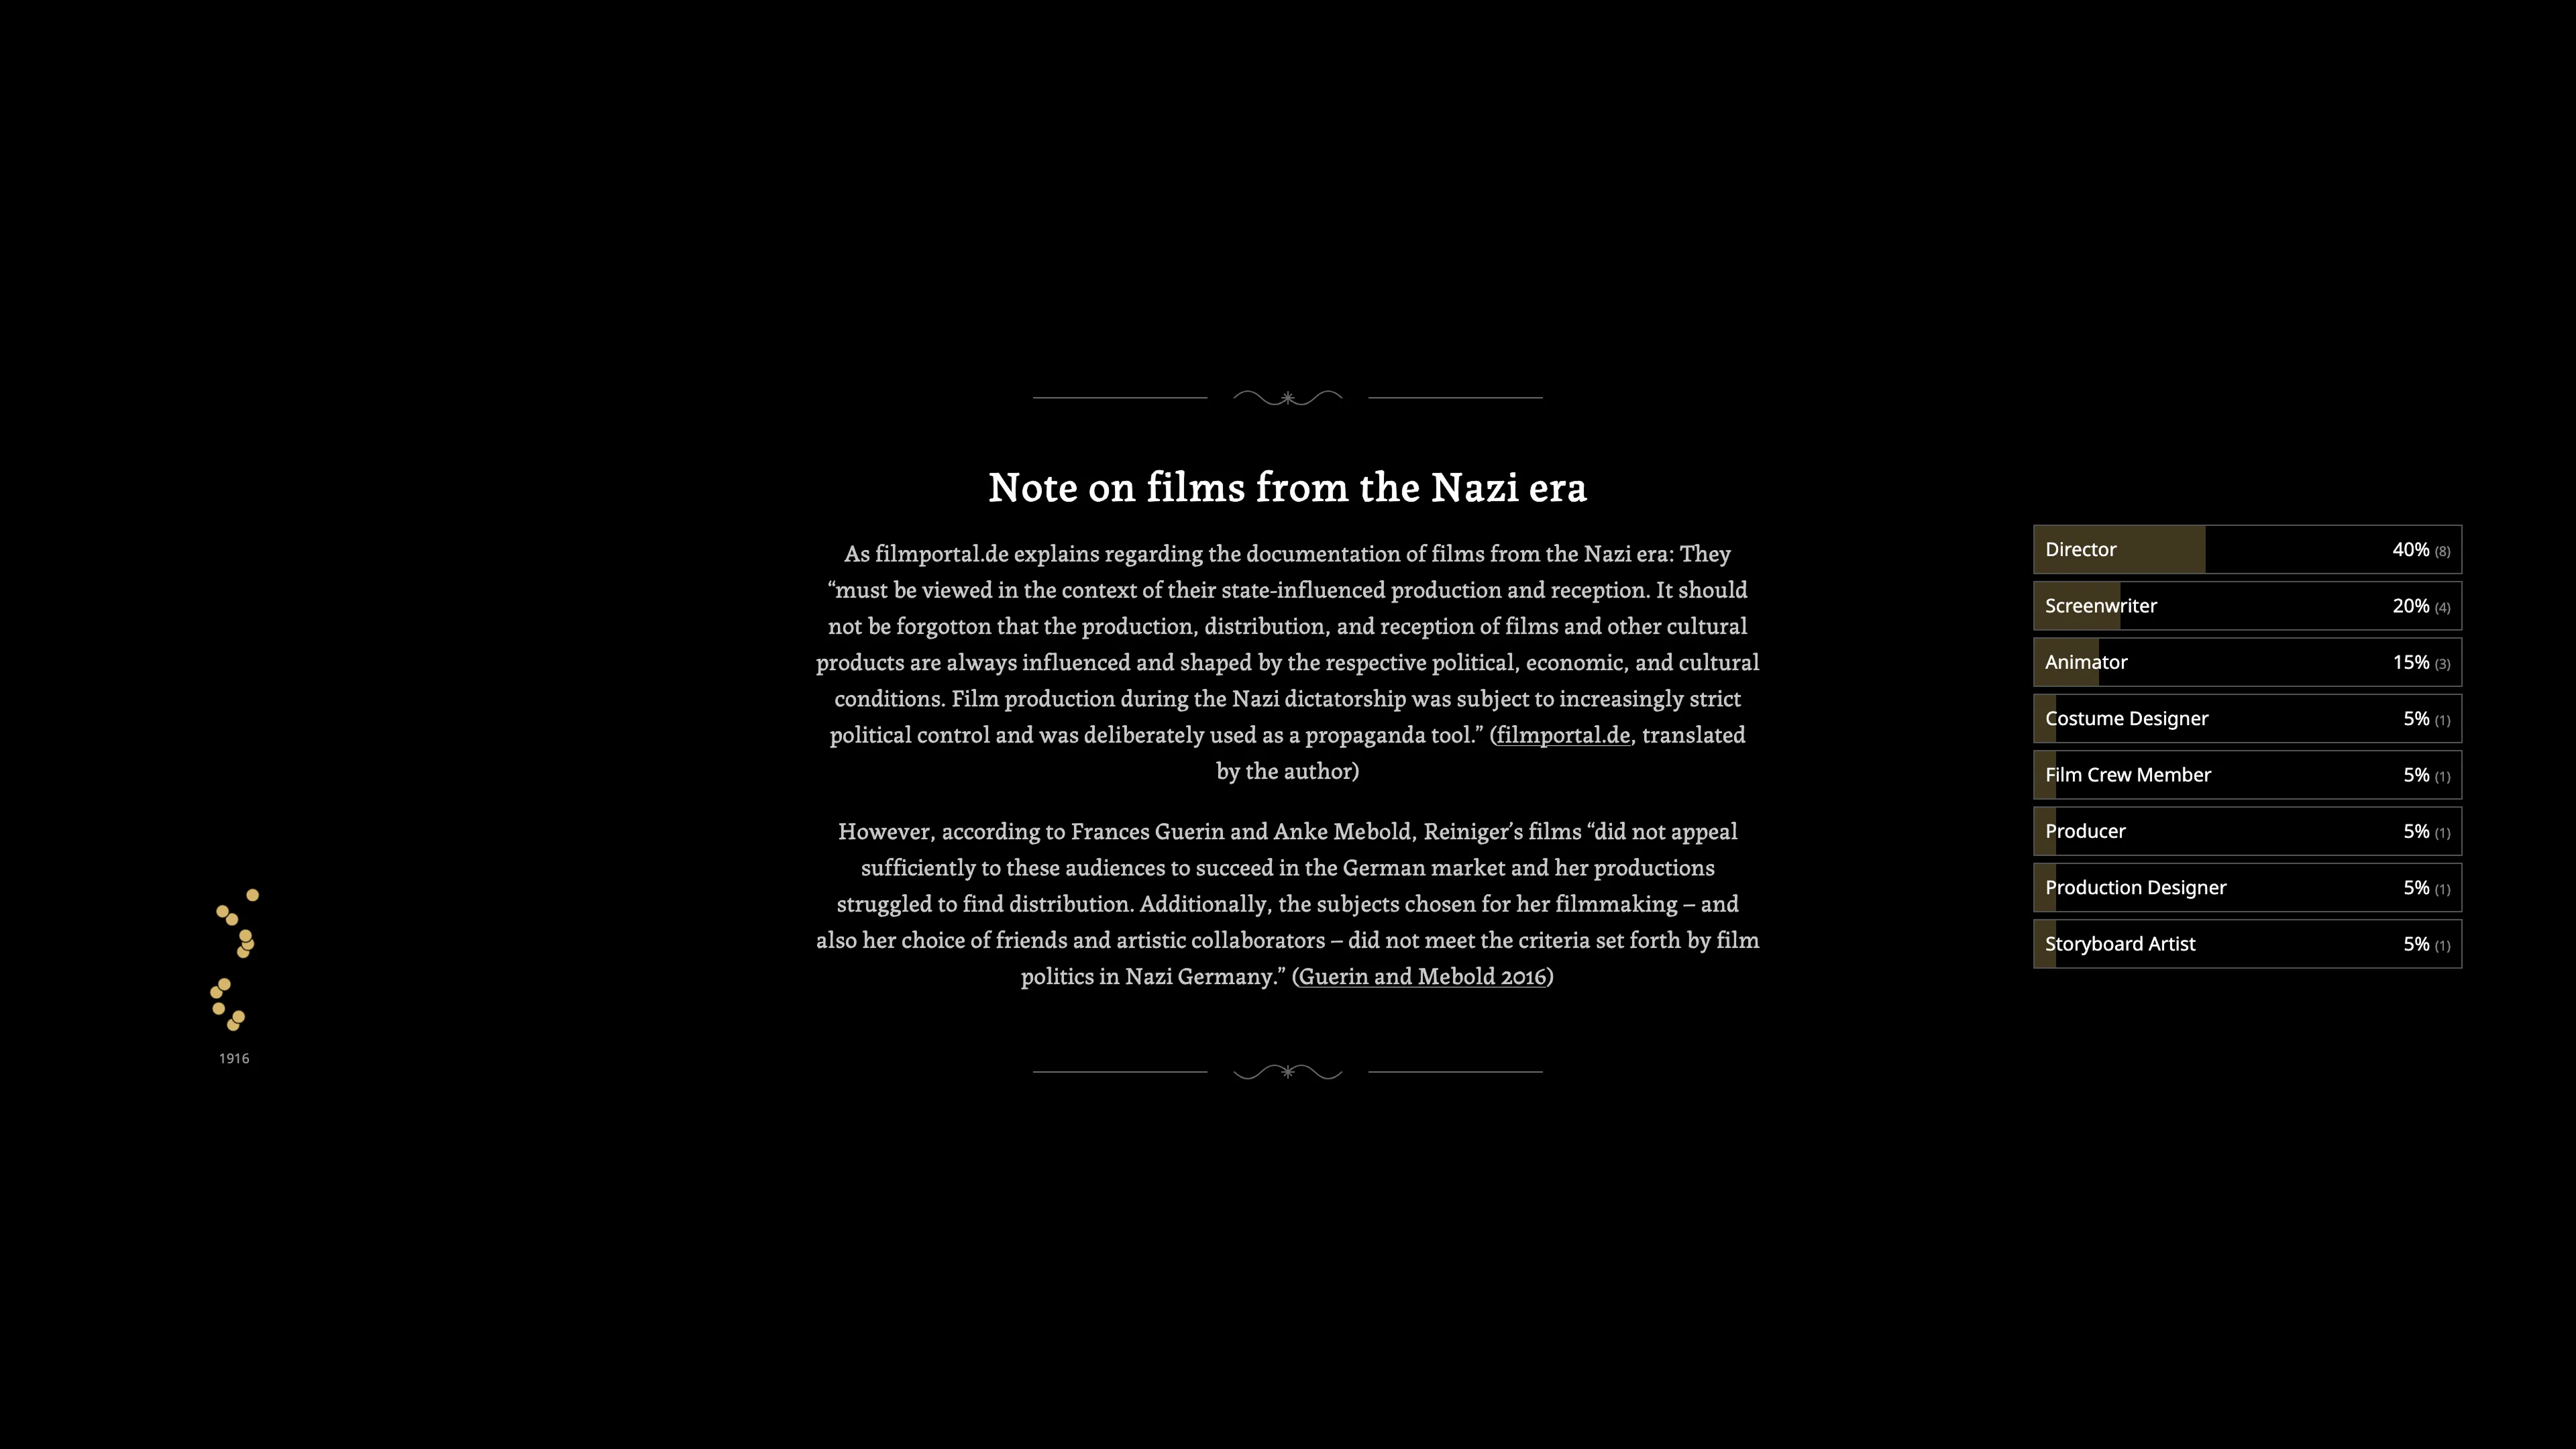
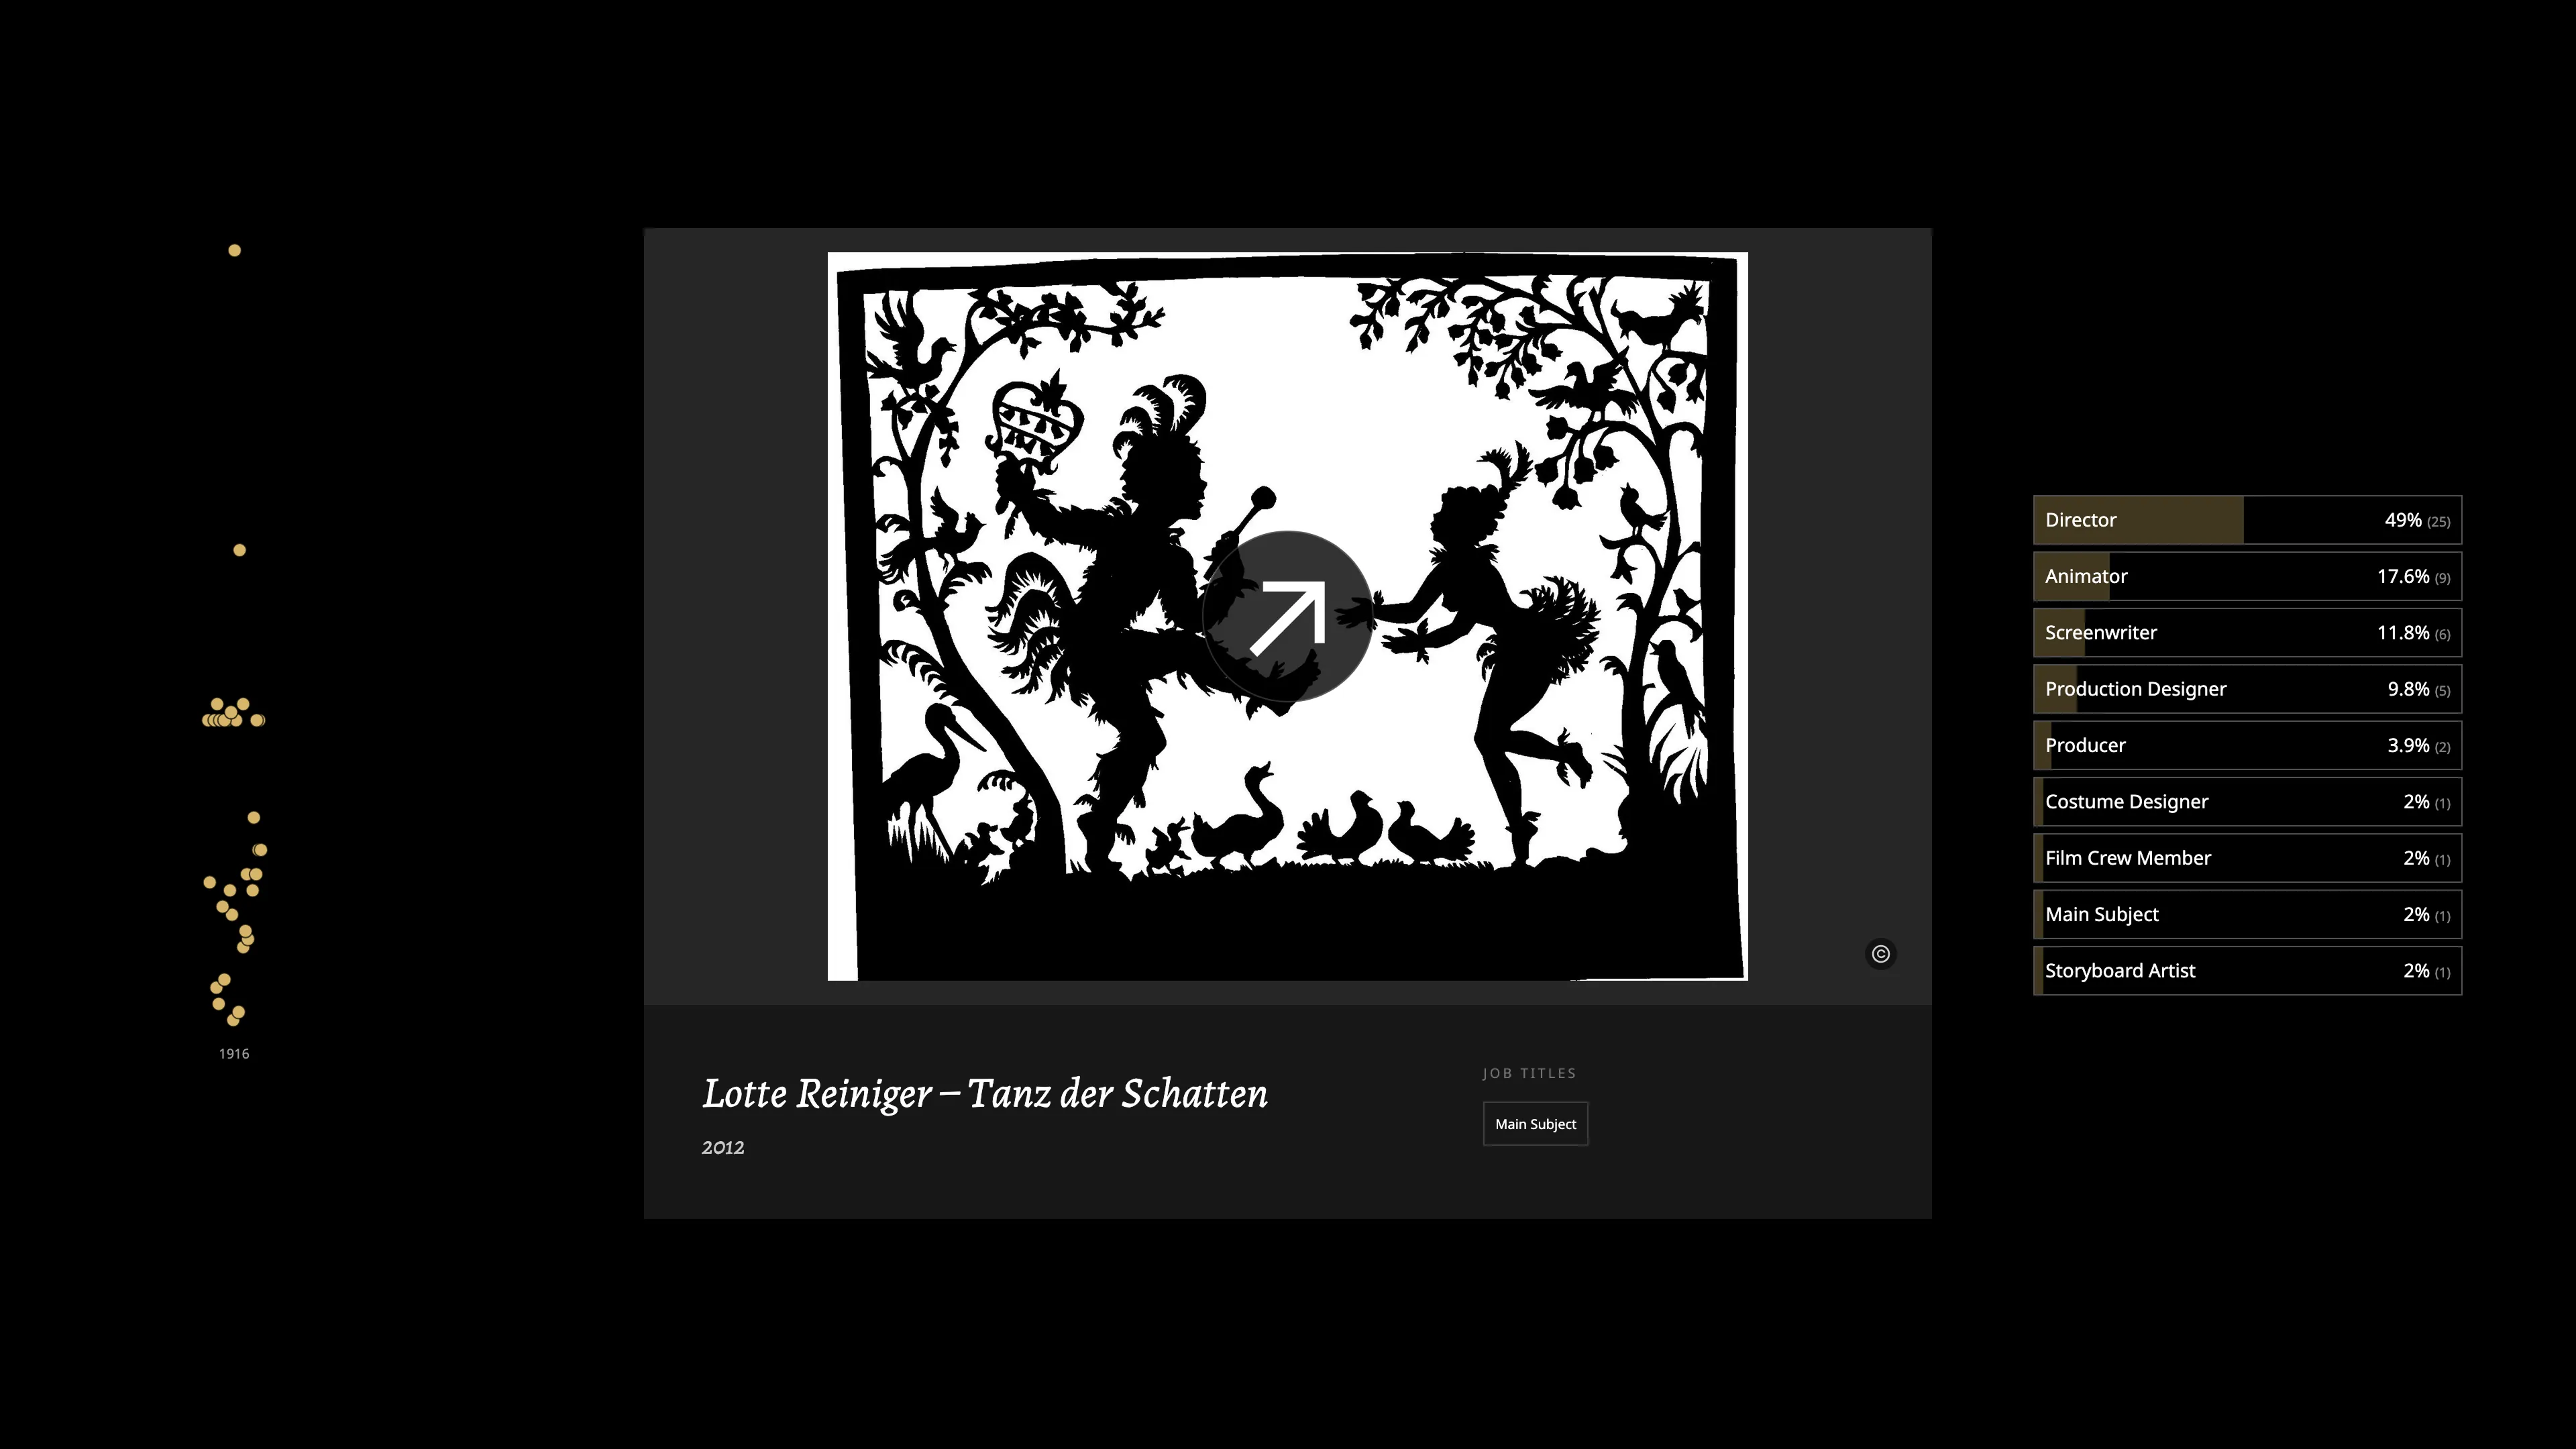
This project sharpened something that had been forming for a while: visualization is not a neutral act. By abstracting data into dots and bars, it is easy to make the thing being described less present, not more. The decision to show Reiniger's actual films, putting her art in front of readers before asking them to think about metadata, came from a discomfort with how much abstraction can distance audiences from what is actually at stake.

Contact
Do you need support for your next project?
Time zone
Current time
Reply time
Your next project starts with a conversation. Not sure if your project is a good fit? Read the FAQ first, it might answer your question before we even talk.